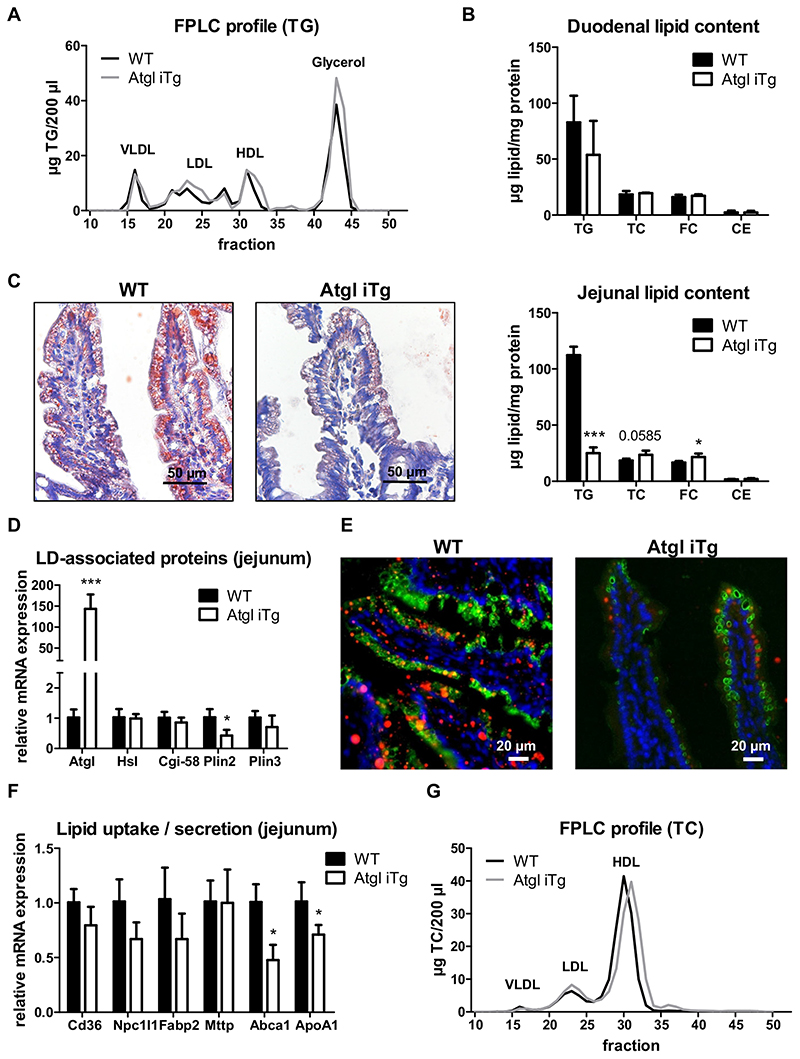
Fig. 3. Atgl overexpression drastically reduces jejunal TG levels upon oral lipid bolus. Chow diet-fed WT and Atgl iTg mice were sacrificed 4 h after an oral oil bolus.
(A) TG distribution among lipoprotein classes. (B) Duodenal lipid levels. (C) Representative oil red O staining and biochemical lipid quantification in jejuna. Scale bar, 50 μm. (D) Jejunal mRNA expression of LD-associated proteins normalized to cyclophilin A. (E) Jejuna of mice sacrificed 4 h post-gavage of BODIPY®-C12 (red) were stained with anti-PLIN2 (green) to detect LDs. Nuclei were visualized by DAPI staining (blue). Scale bar, 20 μm. (F) Jejunal mRNA expression of genes involved in cholesterol metabolism normalized to cyclophilin A. (G) TC distribution among lipoprotein classes. Data represent mean values of 33 week-old female mice (n = 3-4) + SD. * p < 0.05; *** p ≤ 0.001. (For interpretation of the references to color in this figure legend, the reader is referred to the web version of this article.)

