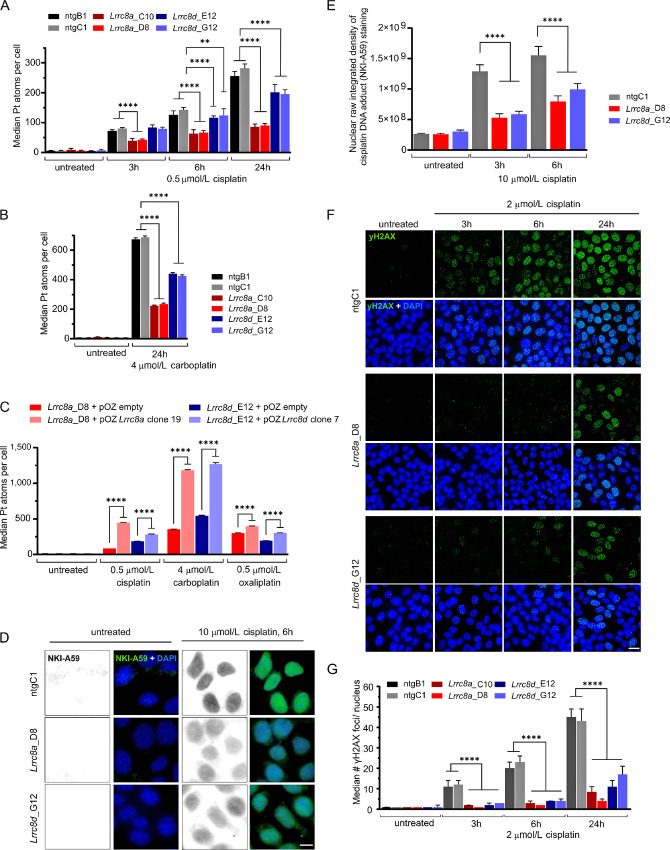
FIGURE 2.
Loss of Lrrc8a or Lrrc8d reduces cisplatin uptake and the subsequent formation of Pt-DNA adducts and DNA damage. A, CyTOF-based measurement of Pt uptake over time using 0.5 μmol/L cisplatin in nontargeting (ntg) control, Lrrc8a-, or Lrrc8d-KO cell lines. The data represent the mean ± SD of three independent replicates consisting of three technical replicates each, where approximately 100,000 cells per condition and cell lines were acquired (two-way ANOVA followed by Tukey multiple comparisons test, ****, P < 0.0001; **, P < 0.01). B, CyTOF-based measurement of Pt uptake after 24 hours treatment with 4 μmol/L carboplatin of ntg, Lrrc8a-, or Lrrc8d-KO cell lines. The data represent the mean ± SD of three independent replicates where approximately 50,000 cells per condition and cell lines were acquired (two-way ANOVA followed by Tukey multiple comparisons test, ****, P < 0.0001). C, CyTOF-based measurement of Pt uptake after 24 hours treatment with 0.5 μmol/L cisplatin, 4 μmol/L carboplatin, or 0.5 μmol/L oxaliplatin of selected clonal Lrrc8a-, or Lrrc8d-high expression rescue lines compared with the empty vector transduced KO cell line. The data represent the mean ± SD of three independent replicates where approximately 50,000 cells per condition and cell lines were acquired (two-way ANOVA followed by Tukey multiple comparisons test, ****, P < 0.0001). D, Representative images of the average nuclear staining in ntg or Lrrc8a- or Lrrc8d-KO cell lines using the NKI-A59 antibody against cisplatin-adducts in the presence or absence of 10 μmol/L cisplatin treatment for 6 hours; scale bar, 10 μm. E, Quantification of the raw integrated density per nucleus of the NKI-A59 cisplatin adduct staining, mean with ± 95% confidence interval of three independent replicates are shown. Per replicate approximately 100 nuclei were quantified. The significance was determined using two-way ANOVA followed by Tukey multiple comparison test. ****, P < 0.0001. F, Representative images of yH2AX immunofluorescence staining of Lrrc8a−/−, Lrrc8d−/−, and control cell lines following cisplatin treatment. Scale bar, 20 μm. G, Quantification of yH2AX foci in the nucleus of Lrrc8a−/−, Lrrc8d−/− and control cell lines in response to cisplatin treatment. Per cell line and condition, 200 nuclei were quantified each replicate. Median ± 95% confidence interval of three independent replicates are shown (ordinary one-way ANOVA followed by Tukey multiple comparisons test, ****, P < 0.0001).

