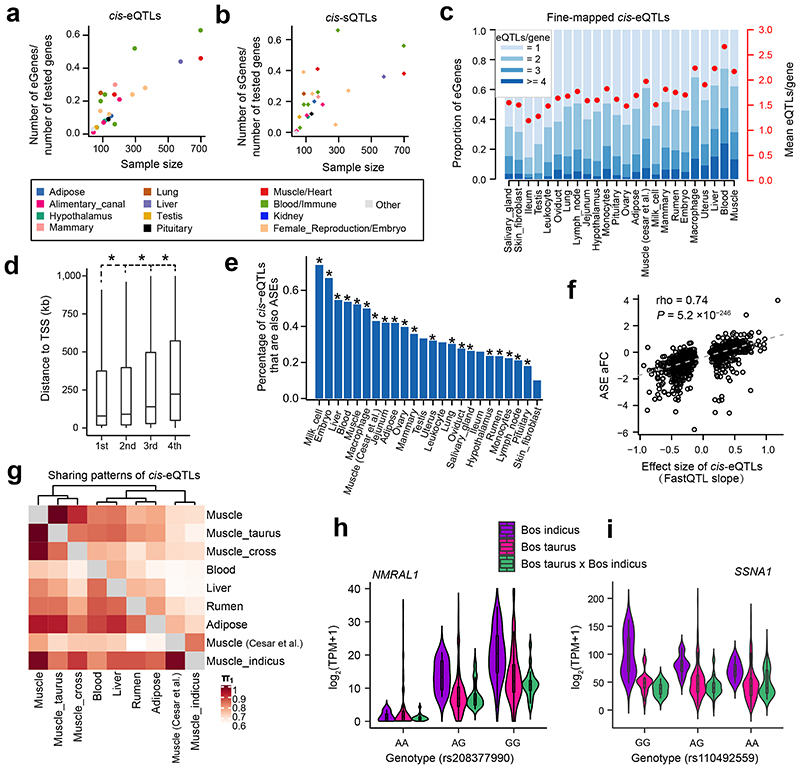
Figure 3. Discovery and characterization of cis-eQTLs and cis-sQTLs.
(a) Relationship between the percentages of eGenes over all tested genes and sample size (Pearson r = 0.85; the two-sided Student’s t-test: P = 1.30×10⁻⁷) across 23 distinct tissues. (b) Relationship between the percentage of sGenes over all tested genes and sample size (Pearson r = 0.63; the two-sided Student’s t-test: P = 1.06×10⁻³) across 23 distinct tissues. Tissues are colored according to their tissue categories. (c) Distribution and average number of conditionally independent eQTLs per gene across tissues. Tissues are ordered by sample size. (d) The distance to Transcription Start Site (TSS) increases from the 1st to 4th independent eQTLs. Only 7276 gene-tissue pairs with at least 4 independent eQTLs were chosen. Significant differences (denoted as *) were observed between 1st vs. 2nd (P = 2.4×10⁻³), 2nd vs. 3rd (P = 3.0 ×10⁻²⁶) and 3rd vs. 4th (P = 1.9×10⁻²⁷) independent eQTLs based on the two-sided paired sample t-test. (e) cis-eQTLs are significantly (P < 1.0×10⁻¹⁴, denoted as *, Fisher Exact test) overrepresented in the loci with allelic specific expression (ASE). The y-axis indicates the percentage of cis-eQTLs that are also ASEs over all tested SNPs in the ASE analysis. (f) Correlation of effect sizes (FastQTL slope) of cis-eQTLs and allelic fold change (aFC) of ASEs (Spearman’s rho = 0.74, the two-sided Student’s t-test: P = 5.2×10-246) in liver. (g) Pairwise cis-eQTL sharing patterns (π1 value) of muscle tissue across three breeds (Bos indicus, Bos taurus and their crosses) and other tissues. Rows are discovery tissues, and columns are validation tissues. Muscle (Cesar et al.) is for 160 skeletal muscle samples of Bos indicus downloaded from Cesar et al. 20188. (h) A cis-eQTL (rs208377990) of NMRAL1 in muscle is shared across Bos indicus (n = 51), Bos taurus (n = 505) and their crosses (n = 108). (i) A cis-eQTL (rs110492559) of SSNA1 in muscle is specific in Bos indicus (MAF = 0.25 and 0.37 in Bos taurus and Bos indicus, respectively), and has a significant (the two-sided t-test, P = 5.61×10⁻³) genotype × breed interaction. The samples are the same as in (h).

