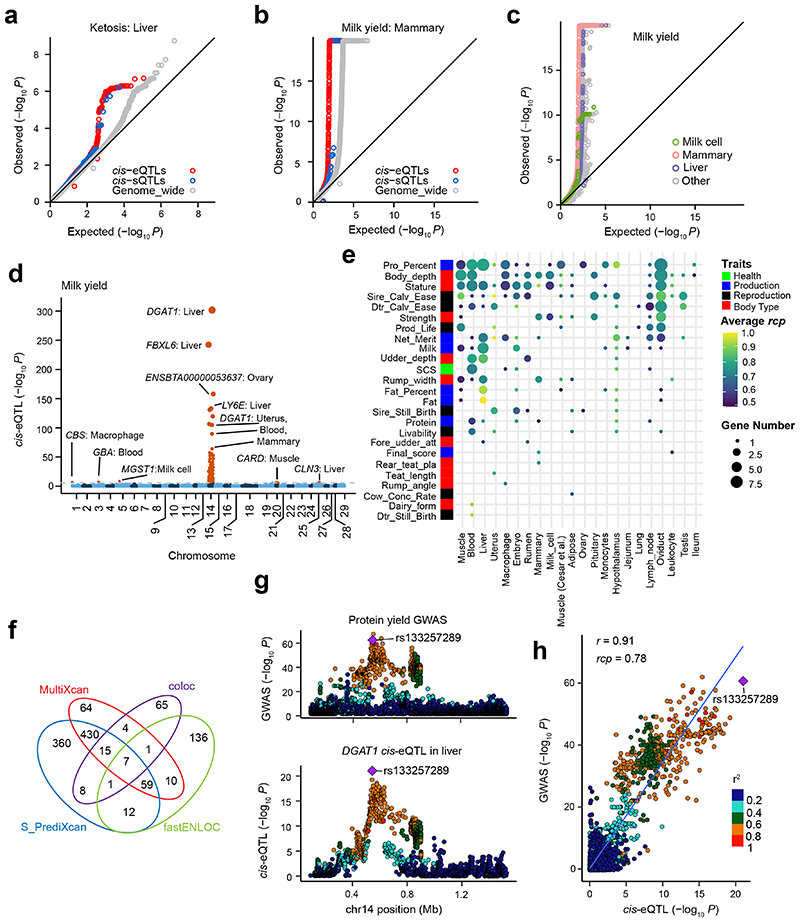
Figure 6. Relationship between complex traits and cis-QTLs.
(a) cis-eQTLs (P = 0.001) and cis-sQTLs (P = 0.02) in liver show significantly higher enrichments for top SNPs associated with ketosis compared to genome-wide SNPs (shown in grey). (b) cis-eQTLs (P = 0.001) and cis-sQTLs (P = 0.03) in mammary gland show higher enrichments for top SNPs associated with milk yield compared to genome-wide SNPs (shown in grey). All the P values above are obtained by the two-sided permutation test with 1,000 times. (c) Enrichment of cis-eQTLs for genetic associations with milk yield is tissue-dependent. The cis-eQTLs in mammary gland, milk cells and liver exhibit higher enrichments for genetic associations with milk yield compared to those in other tissues. (d) Manhattan plots of transcriptome-wide association study (TWAS) for milk yield across all 23 distinct tissues. (e) The number of genes that were colocalized (regional colocalization probability, rcp > 0.5 in fastENLOC) between GWAS significant loci of complex traits and cis-eQTLs across tissues. The size of point indicates the number of genes, while the color of point indicates the average rcp of each trait-tissue pair. The abbreviations of GWAS traits are explained in Supplementary Table 10. (f) The overlaps of significant gene-trait pairs from TWAS with S-PrediXcan (Bonferroni corrected P < 0.05) and S-MultiXcan (Bonferroni corrected P < 0.05) and colocalization with fastENLOC (rcp > 0.5) and Coloc (posterior probability of the shared single causal variant hypothesis H4 (PP.H4) > 0.8). (g) An example of a colocalization (rcp = 0.78) of cis-eQTLs of DGAT1 gene in liver and GWAS loci of protein yield in cattle on chromosome 14. The top colocalized SNP (rs133257289) is the top cis-eQTL of DGAT1 and the second top GWAS signal of protein yield. (h) A high Pearson correlation (r = 0.91, the two-sided Student’s t-test: df = 2,933; P < 2.2×10-308) between P-values from cis-eQTLs of DGAT1 in liver and GWAS of protein yield.

