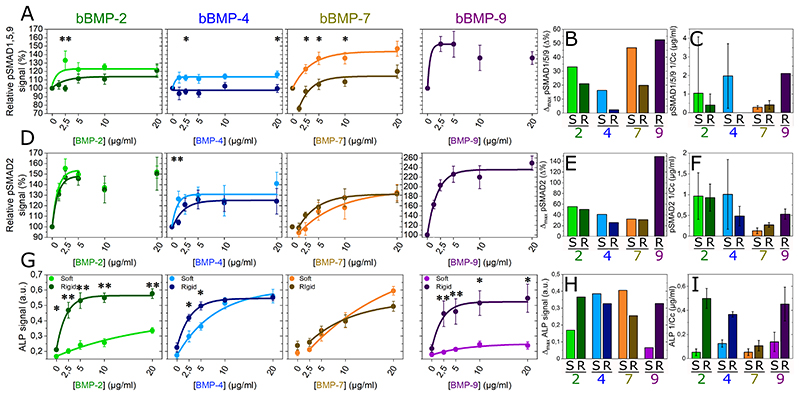
Fig. 2. pSMAD and ALP analyses for the four bBMPs on soft and rigid films.
Fluorescent signal quantification of (a) pSMAD1,5,9, (d) pSMAD2, and (g) ALP activity as a function of the BMP concentration in soft (S) (light color) and rigid (R) films (dark color). Quantitative parameters Δmax and 1/Cc extracted from the fit of each of the experimental curves for (b, c) pSMAD1,5,9, (e, f) pSMAD2 and (h, i) ALP. Data represent the mean + SEM of 2 to 4 independent experiments with two samples per condition in each independent experiment (at least 400 cells were analyzed in total). Statistical tests were done using non-parametric Kruskal-Wallis ANOVA test to compare S and R films (*p < 0.05; **p < 0.01).

