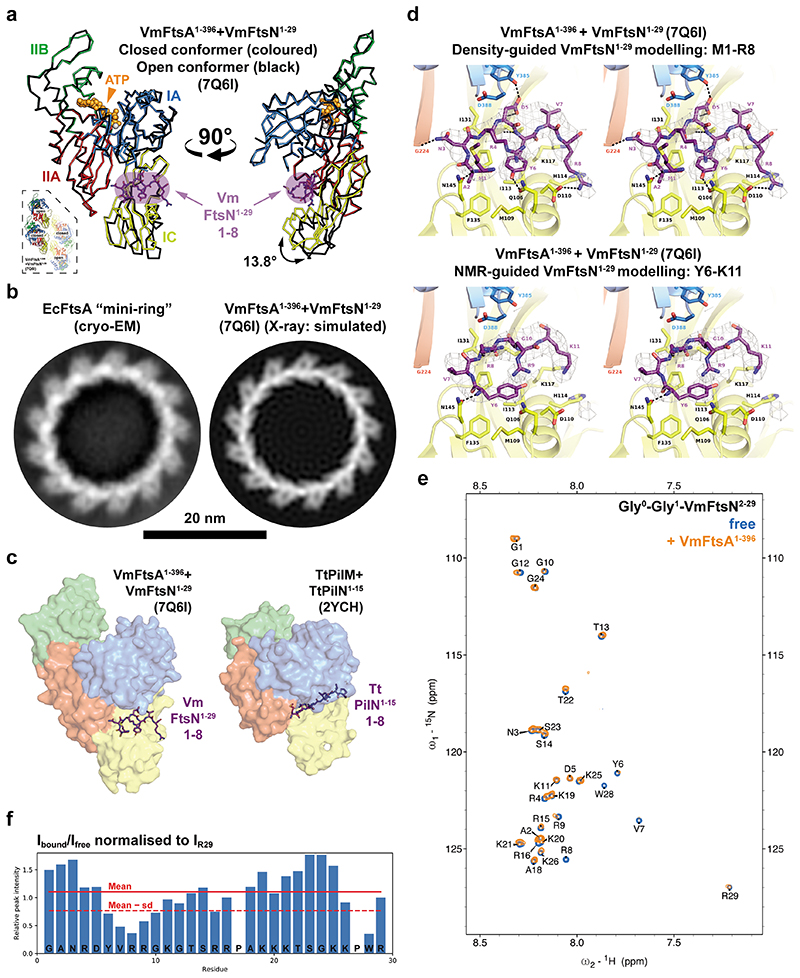
Extended Data Figure 3. Modelling of VmFtsN1-29 binding to VmFtsA1-396.
a, Comparison between the peptide-bound closed (coloured) and peptide-free open conformer (black) of FtsA in the VmFtsA1-396-VmFtsN1-29 co-crystal structure (PDB 7Q6I). The IC domain of the open conformer is rotated 13.8° downwards compared to the closed conformer, as determined by analysis with DynDom38. Consequently, the open conformation is likely incompatible with VmFtsN1-29 binding. The inset shows the position of open and closed conformers within the tetramer. b, Left: EcFtsA forms “mini-rings” on lipid monolayers as determined by cryo EM. Two independent grids were examined. Data was collected on one grid. Right: a computed 2D projection after expansion of a longitudinal dimer from the VmFtsA1-396-VmFtsN1-29 co-crystal structure (PDB 7Q6I) is shown for comparison. The expanded longitudinal dimer does not form a closed ring but a helix. The comparison illustrates that FtsA’s IA domains are facing outwards. Scale bar, 20 nm. c, Comparison between the V. maritimus FtsA-FtsN and Thermus thermophilus PilM-PilN (PDB 2YCH) interaction sites39. Both binding sites are in the IA-IC interdomain cleft of FtsA and PilM but occupy distinct subspaces. FtsN predominantly contacts the IC domain of FtsA, whereas PilN binds closer to the IA domain of PilM. d, Stereo images of the FtsA-FtsN interaction site in the VmFtsA1-396-VmFtsN1-29 co-crystal structure (PDB 7Q6I). Top: our preferred interpretation of the electron density corresponding to VmFtsN1-29, with residues M1-R8 modelled (purple). Side chains of FtsA residues in the interaction site are shown as sticks and polar contacts are marked with black, dashed lines. Bottom: electron density interpretation guided by the NMR data instead (panels e and f), with residues Y6-K11 of VmFtsN1-29 modelled (purple). Electron density maps (grey) are shown at 1.2 sigma. e, 1H, 15N 2D-HSQC NMR spectrum of free Gly-Gly-VmFtsN2-29 (blue) and with equimolar amounts of FtsA added (orange). To follow VmFtsN numbering, the first glycine of Gly-Gly-VmFtsN2-29 is assigned as G0. f, Changes in relative peak intensity expressed as Ibound/Ifree with intensities normalised to IR29, which is assumed not to be involved in the VmFtsA-FtsN interaction.

