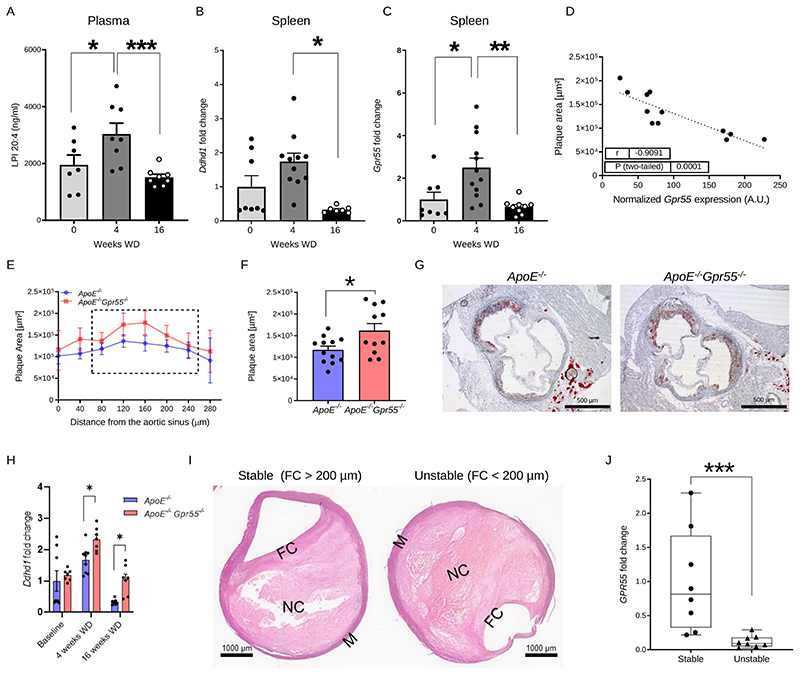
Figure 1. Regulation and function of GPR55 signaling in atherosclerosis.
(A-D) Plasma, spleens and aortic roots were collected from Apoe-/- mice at baseline or after 4 and 16 weeks WD to determine (A) lysophosphatidylinositol (LPI) plasma concentrations (n=7-8; * p=0.05; ***p=0.0042) or (B-C) relative splenic mRNA expression of the gene encoding the LPI-synthesizing enzyme DDHD1 (n=7-8; p=0.0018) and the LPI receptor GPR55 (n=7-8; * p=0.019; **p=0.0028). (D) Splenic Gpr55 mRNA expression values were plotted against the aortic root plaque areas of the same mice (n=12). (E) Plaque area per aortic root section of female Apoe-/- and Apoe-/-Gpr55-/- mice after 4 weeks WD (n=11-12 per group; (* p=0.023). The dotted square indicates the sections used for calculating the average plaque area per animal shown in (F). (G) Representative Oil-Red-O stains of aortic roots after 4 weeks WD. (H) Splenic Ddhd1 mRNA expression of baseline, 4 and 16 weeks WD Apoe-/- and Apoe-/-Gpr55-/- mice, (for baseline n=7-9; for 4 weeks n=6-8 and * p=0.04 and for 16 weeks n=6-7 and *p=0.035) (I) Representative pictures of human stable and unstable plaques (obtained from the Munich Vascular Biobank, shown is one of the eight samples evaluated. (J) Human GPR55 mRNA expression evaluated by qPCR in stable vs. unstable/ruptured carotid artery plaque corrected by RPLPO used as housekeeping control (*** p=0.0006). The box plot shows the min to max value and each dot represents one patient. Mouse data shown in A-F were combined from 3 independent experiments, each dot represent one biologically independent mouse sample. All data are shown as mean ± SEM. Two-sided unpaired Student's t-test or one-Way-ANOVA followed by a post-hoc Newman–Keuls multiple-comparison test was used to determine the significant differences. Bivariate correlation was analyzed by Spearman’s rank correlation test. FC, fibrous cap; LPI, lysophosphatidylinositol; M, media; NC, necrotic core; WD, Western diet.

