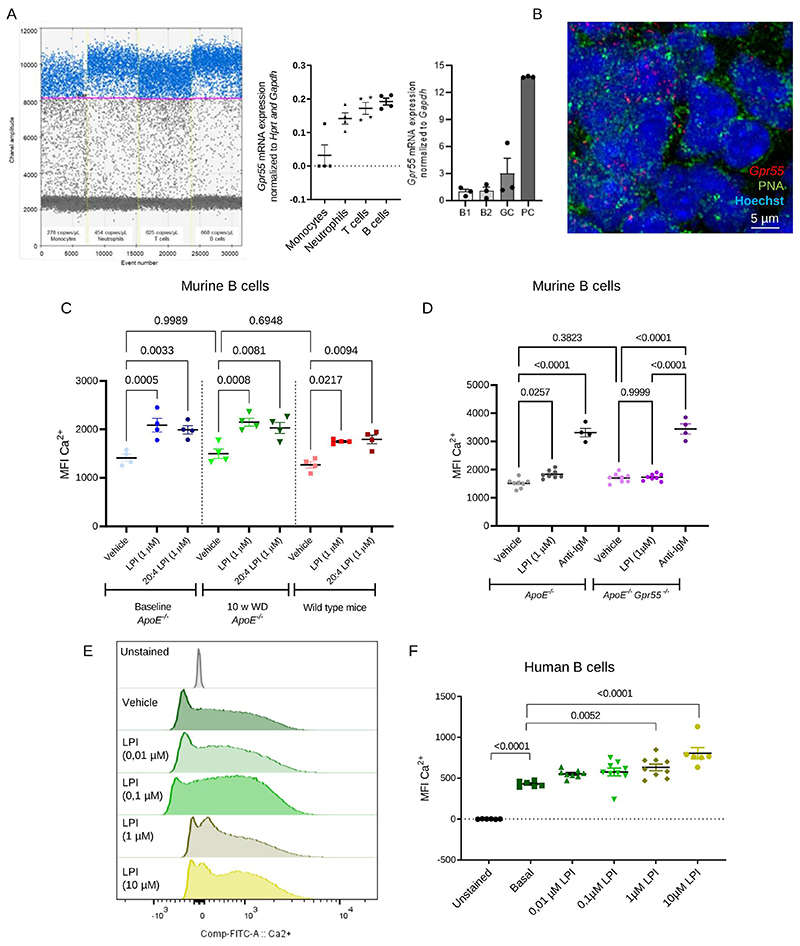
Figure 2. GPR55 expression and Ca2+ responses in murine and human B cells.
(A) Gpr55 mRNA expression determined by digital droplet PCR (left) and qPCR (right) in sorted circulating leukocyte subsets and splenic B cell subsets. Each dot represents sorted cells isolated from a biologically independent Apoe-/- mouse sample (n=3-4). (B) In situ hybridization to detect Gpr55 (red) in splenic GC areas (PNA+, green; nuclei, blue). The assay was performed with 3 independent Apoe-/- mouse samples. (C) Average mean fluorescence intensity (MFI) of intracellular Ca2+ sensor in circulating B cells of Apoe-/- mice under normal diet (baseline) or 10 weeks Western Diet and C57BL/6J wild type mice under normal diet, in response to soybean LPI or pure 20:4 LPI stimulation (n=4). (D) Average mean fluorescence intensity (MFI) of intracellular Ca2+ sensor in circulating B cells of Apoe-/- and Apoe-/-Gpr55-/-. mice in response to LPI or anti-IgM stimulation (n=4-8). (E) Representative histogram and (F) average MFI of intracellular Ca2+ sensor in human B cells at baseline conditions and after addition of vehicle or LPI. Data were combined from 2 independent experiments, and each dot represent one biologically independent mouse or human sample (n=7-8) All data are shown as mean ± SEM). One-Way-ANOVA followed by a post-hoc Newman–Keuls multiple-comparison or two-way-ANOVA followed with Kruskal–Wallis test with Dunn post hoc test was used to evaluate the significant differences. GC, germinal center; LPI, lysophosphatidylinositol; MFI, mean fluorescence intensity; PC, plasma cell; w, weeks; WD, Western diet.

