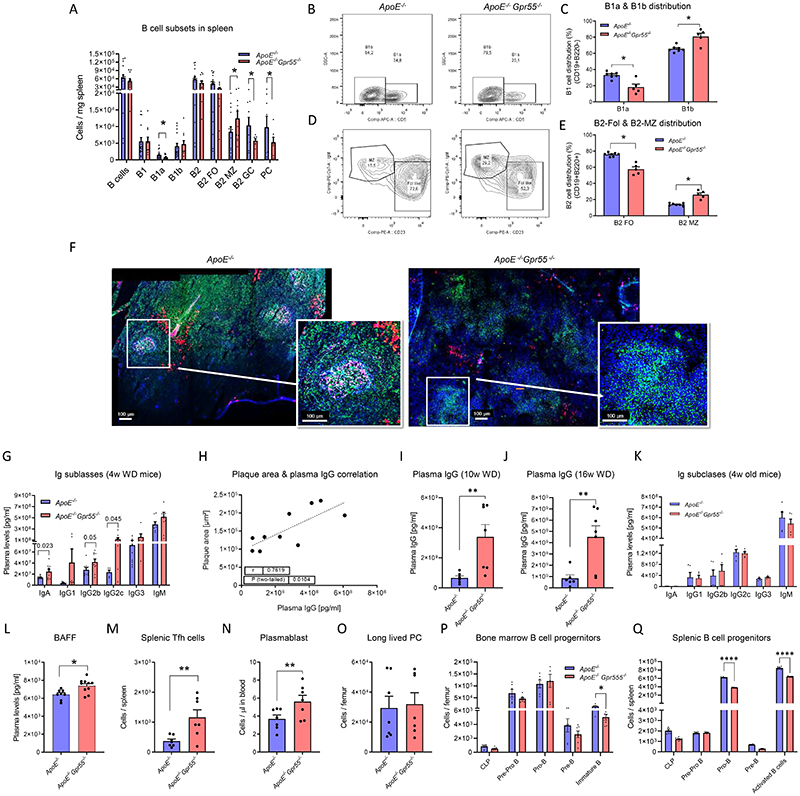
Figure 3. B cell immunoprofiling of global Gpr55-deficient mice after 4 weeks WD.
(A) Splenic B cell subsets quantified by flow cytometry (n=15-16; * p=0.05). (B, C) Representative gating strategy and relative proportion of B1 cell subsets. (D, E) Representative gating strategy and relative proportion of B2 cell subsets (n=5-7; * p=0.05). (F) Confocal imaging of spleen sections stained for B cell markers PNA (GC, green), IgM (MZ or memory B cells, red), CD23 (FO B cells, pink) and nuclei (blue). Six independent samples were analysed. (G) Plasma Ig titers (n=6-9) and (H) IgG titers plotted against aortic plaque size in Gpr55-deficient mice (n=10) (I) Plasma IgG titers in mice after 10 (n=6-7; *p=0.0047) (J) or 16 weeks Western diet (n=6-7; *p=0.0045). (K) Plasma Ig titers in young 4-week-old mice (n=5) (L). B cell activating factor (BAFF) concentrations after 4 weeks WD (n=8-10; **p=0.0098). (M) Number of splenic T follicular helper (Tfh) cells (n=7; **p=0.010)., (N) circulating plasmablasts (n=7; **p=0.035). and (O) long-lived plasma cells (PC) in bone marrow assessed by flow cytometry after 4 weeks WD. (P) Lymphoid B cell progenitors in the bone marrow (n=5-7; *p=0.05). and (Q) spleen after 4 weeks WD (n=5-7; **** p<0.0001). Data were combined from 2 independent experiments for all figure panels, and each dot represent one biologically independent mouse sample (mean ± SEM). Two-sided unpaired Student’s t-test was used to determine the significant differences. BAFF, B-cell activating factor; GC, germinal center; FO, follicular; Ig, immunoglobulins; MZ, marginal zone; PC, plasma cell; w, weeks; WD, Western diet.

