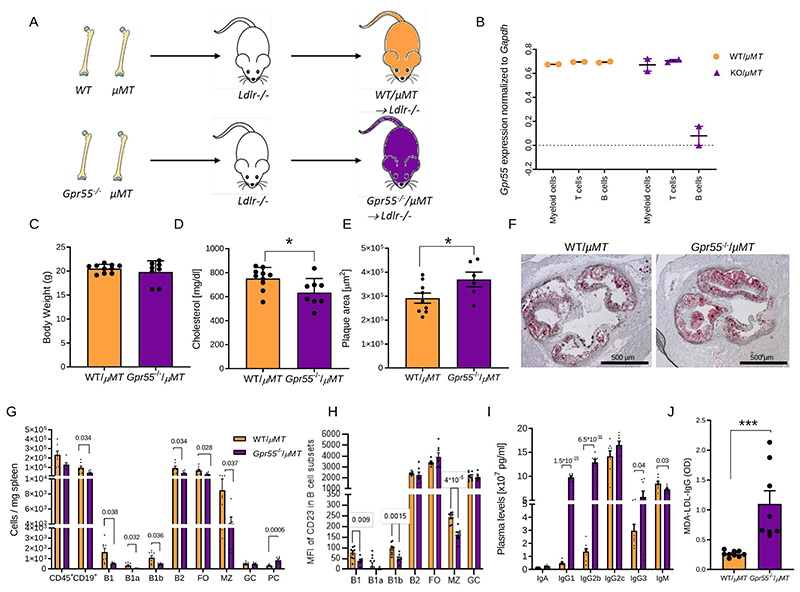
Figure 5. Impact of B cell-specific Gpr55 deficiency on atherosclerotic plaque development and B cell responses during hypercholesterolemia.
(A) Experimental design of the bone marrow transplantation to generate mixed bone marrow chimeras with B cell-specific Gpr55 deficiency. Lethally irradiated Ldlr-/- mice received a 50/50 mixture of μMT marrow and Gpr55-/- or WT marrow cells. (B) Following 6 weeks recovery after the bone marrow transplantation, Gpr55 expression was measured by qPCR in sorted blood myeloid cells (Cd11b+), T cells (CD3+) and B cells (B220+) to determine the B cell Gpr55 depletion efficiency in Gpr55-/-/μMT → Ldlr-/- mice (n=2). (C) Body weight (n=8-9) and (D) total plasma cholesterol concentration after 10 weeks WD (n=8-9; * p=0.029). (E) Plaque area in aortic roots of bone marrow chimeric female mice after 10 weeks WD (n=6-8; p=0.049). (F) Representative Oil-Red-O stained aortic root sections used for plaque quantification. (G) Splenic B cell subsets assessed by flow cytometry (n=6-8; exact p value is shown for each Ig subset in the graph). (H) Average mean fluorescence intensity (MFI) of CD23 in the different B cell subsets (n=7-9; exact p value is shown for each B cell subset in the graph). (I) Plasma Ig titers at the end of the experiment (n=6-8; exact p value is shown for each Ig subset in the graph). (J) IgG antibodies against MDA-oxLDLin plasma after 10 weeks WD (n=8-9; ***p=0.0011). Data were obtained in one bone marrow transplantation experiment; and each dot represent one biologically independent mouse sample (mean ± SEM). Two-sided unpaired Student’s t-test was used to determine the significant differences. FO, follicular; GC, germinal center; LPI, lysophosphatidylinositol; MFI, mean fluorescence intensity; MZ, marginal zone; PC, plasma cell; WT, wildtype.

