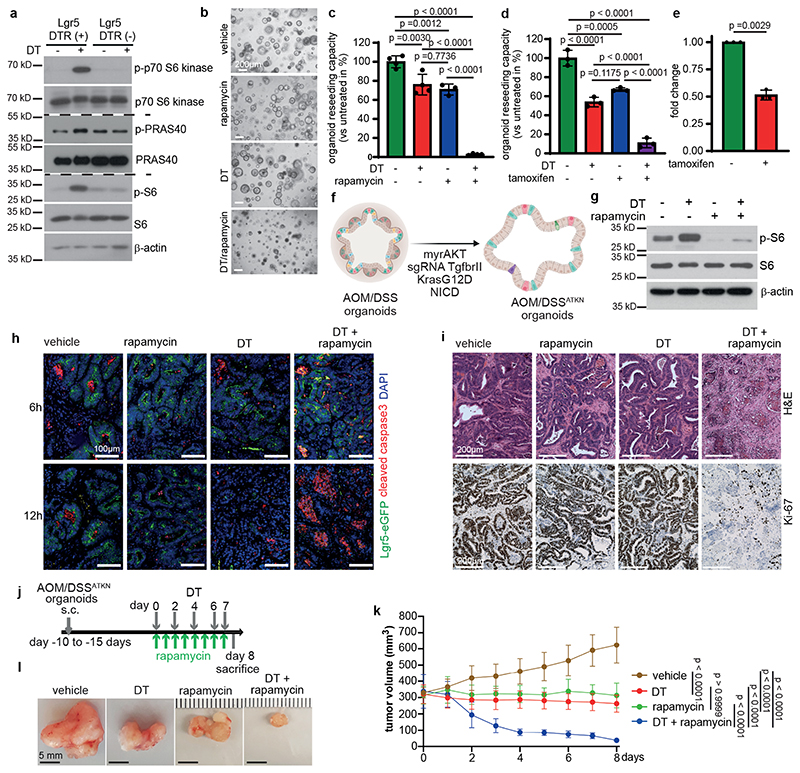
Figure 2. Dying tumor cells induce mTOR survival signaling in a paracrine manner.
a, Immunoblotting of DT treated Lgr5EGFP-DTR(+) and Lgr5EGFP-DTR(-) tumor organoids (n = 3). PRAS40 and phospo-PRAS40 were probed on a separate gel (see SI).
b, Representative Lgr5EGFP-DTR(+) tumor organoids treated as indicated (n=3, scale bar = 200μm).
c, Reseeding capacity of Lgr5EGFP-DTR(+) tumor organoids treated as indicated (n=4, one of three biological replicates).
d, Reseeding capacity of Villin-CreER Raptor ;Lgr5EGFP-DTR(+) tumor organoids treated as
indicated (n=3, one of three biological replicates).
e, Raptor qRT-PCR analysis of tamoxifen-induced Villin-Cre ERT2;RaptorF/F;Lgr5EGFP-DTR(+) tumor organoids (n=3 biological replicates).
f, Schematic representation of AOM/DSSATKN tumor organoid generation.
g, Immunoblotting of AOM/DSSATKN tumor organoids treated as indicated (n=3).
h, AOM/DSSATKN tumor organoids were injected subcutaneously. Once tumors reached 200 mm3, mice were treated as indicated and analysed after 6h or 12h for cleaved caspase-3 and Lgr5-GFP. Nuclei were counterstained with Dapi. Representative images from at least 2 mice/timepoints (scale bar = 100μm).
i, AOM/DSSATKN tumor organoids were injected subcutaneously. Once tumors reached 200 mm3, mice were treated as indicated for 24h and analysed by H&E and Ki-67 staining. Representative images are shown (n=3 mice, scale bar = 200μm).
j, Treatment regimen of subcutaneous AOM/DSSATKN tumors.
k, Growth rate of subcutaneous AOM/DSSATKN tumors in response to treatment as indicated in (j) (n=5 mice for vehicle and rapamycin, n=6 mice for DT and DT + rapamycin). One set of mice was analysed.
l, Representative images of subcutaneous AOM/DSSATKN tumors on day 8 treated as indicated in (k), (n= same as (k), scale bar = 5mm).
All data are mean ±SD and analysed by two-tailed Student’s t-test (e) or by 1-way ANOVA (c, d) and 2-way ANOVA (k) with Bonferroni’s multiple comparison.

