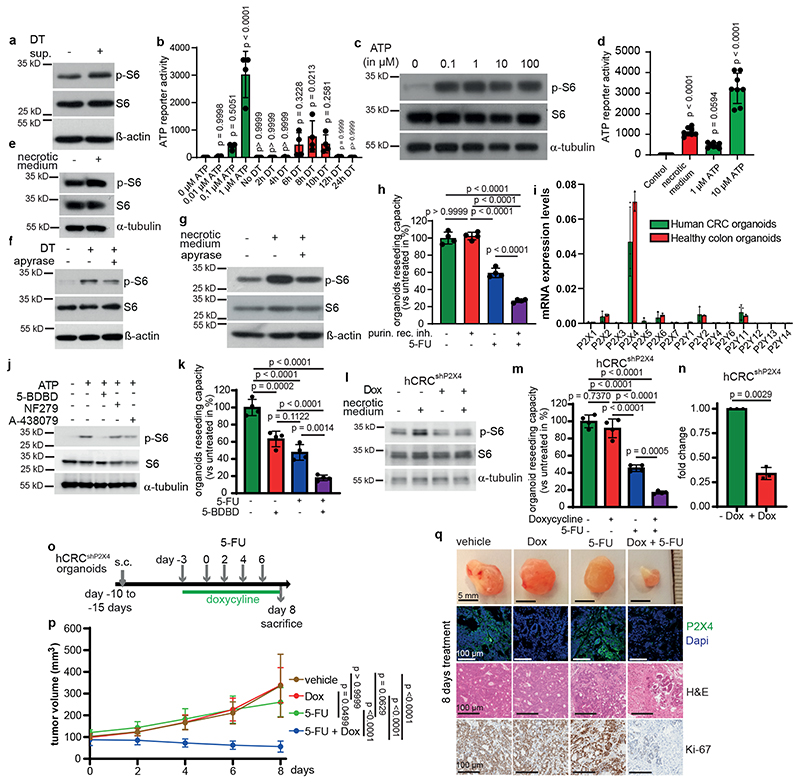
Figure 3. Dying tumor cells release ATP to trigger mTORC1 via P2X4.
a) Immunoblotting of Lgr5EGFP-DTR(-) tumor organoids treated with supernatant from DT-treated Lgr5EGFP-DTR(+) tumor organoids for 2h (n=2).
b, ATP content in supernatants of DT treated organoids (n=4 biological replicates).
c, Immunoblotting of Lgr5EGFP-DTR(-) tumor organoids treated with ATP for 15 min (n=3).
d, ATP content in control or necrotic medium (n=8 biological replicates).
e-g, Immunoblotting of Lgr5EGFP-DTR(+) tumor organoids treated as indicated (e, g were treated 2h, f for 6h) (n=3 for all immunoblots).
h, Reseeding capacity of Lgr5EGFP-DTR(+) tumor organoids treated as indicated (n=4, one of four biological replicates).
i, qRT-PCR analysis of indicated genes in hCRC or healthy colon organoids (n=3, one of two biological replicates).
j, Immunoblotting of hCRC organoids treated as indicated for 15 min. Inhibitors were added 15 min prior to treatment with 100 μM ATP (n=3).
k, Reseeding capacity of hCRC organoids treated as indicated (n=4, one of three biological replicates).
l, Immunoblotting of P2x4 knockdown hCRC organoids (hCRCshP2X4) treated as indicated for 2h (n=3).
m, Reseeding capacity of doxycycline-inducible hCRCshP2X4 tumor organoids treated as indicated (n=4, one of three biological replicates).
n, P2X4 qRT-PCR analysis of doxycycline treated hCRCshP2X4 tumor organoids (n=3 biological replicates).
o, Treatment regimen of subcutaneous hCRCshP2x4 tumors.
p, Growth rate of subcutaneous hCRCshP2X4 tumors in response to 5-FU +/- doxycycline treatment as indicated in (o). (n=6 mice for each condition). One set of mice was analysed.
q, Representative images of tumors and P2x4, Ki67 and H&E staining on tumor sections of mice indicated in (p), (n=6, scale bar = 100μm). Staining was performed on all tumors described in (p).
All data are mean ±SD and analysed by two-tailed Student’s t-test (n) or 1-way ANOVA (b, d, h, k, m) and 2-way ANOVA (p) with Bonferroni’s multiple comparison.

