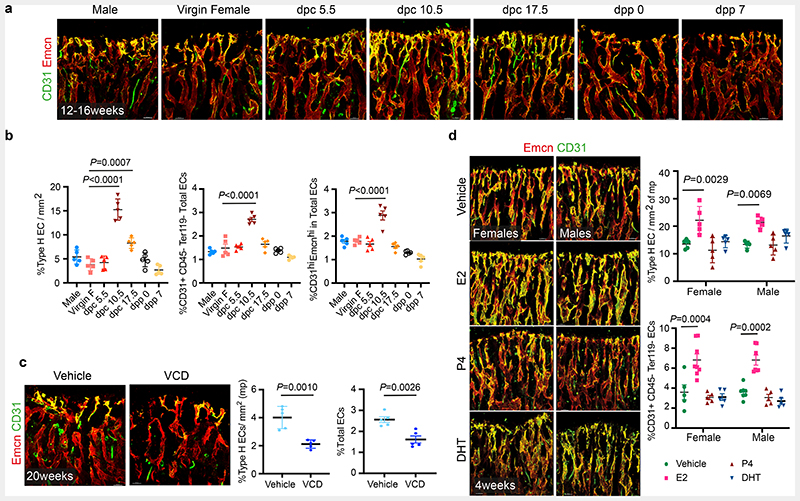
Fig. 1. Oestrogen regulates blood vessel growth in bones.
a, Representative confocal images of Type-H (Emcnhigh CD31high) vessel changes in maternal bones at different time-points of mouse pregnancy and post-delivery. Pregnancy time points are represented in days post-coitum (dpc) and post-delivery days as days post-partum (dpp). Scale bars 40μm
b, Quantification of Type-H vessels described in a, as area of Type-H ECs normalised to area of metaphysis (mp) (n=5); total ECs (CD31+ CD45-Ter119-) and Type-H ECs (CD31high Emcnhigh) characterised by flow cytometry (n=5). Data are mean ± s.d. for image quantification and mean ± s.e.m. for flow cytometry data; One-Way ANOVA with Tukey’s test
c, Representative confocal images of vehicle and VCD (n=5) model mice (20 weeks old) depicting reduced Type-H vessels in VCD model. Scale bars 40μm. Graphs indicate the area of Type-H ECs normalised to the area of mp and total ECs quantified by flow cytometry. Data are mean ± s.d. for image quantification and mean ± s.e.m. for flow cytometry data; Unpaired two-tailed t-test
d, Representative confocal images showing changes in Type-H vessels in male and female mice (P28) upon hormonal treatments with quantification for Type-H ECs, area quantification (n=5); flow cytometry (Vehicle n=5F, n=7M; E2 n=8F, n=7M; P4 n=5F, n=5M; DHT n=5F, n=5M). Data are mean ± s.d. for image quantification and mean ± s.e.m. for flow cytometry data; Two-Way ANOVA with Tukey’s test. Scale bars 40μm.

