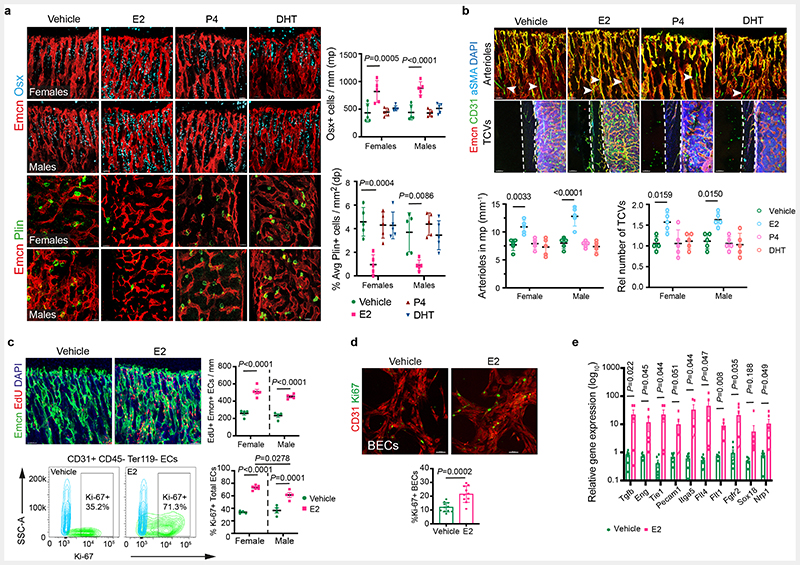
Extended Data Fig. 2. Oestrogen-mediated changes in bone endothelium.
a, Representative confocal images with quantifications of OBLs (Osterix+, n=5) and BM adipocytes (Perilipin+, n=5) of mice treated with different hormones at P28. Data are mean ± s.d.; Two-way ANOVA with Tukey’s test. Scale bars 40 μm.
b, Representative confocal images show endomucin (Emcn, red), CD31 (green), alpha-smooth muscle actin (αSMA, cyan) blood vessels in the metaphysis and cortical bone area. Graphs show quantification of CD31+ Emcn-arterioles (white arrowheads) and TCVs in mice treated with Vehicle, E2, P4 and DHT (n=5); Data are mean ± s.d.; Two-way ANOVA with Tukey’s test. White dotted lines denote the cortical bone region. DAPI is a nuclear counterstain. Scale bars 100 μm (TCVs); 50 μm (arterioles).
c, Representative confocal images of EdU-injected Vehicle and E2-treated mice at P28, with quantification of EdU+ ECs normalised to metaphysis (mp) length (Vehicle n=4F, n=4M; E2 n=5F, n=4M) indicating increased EdU+ ECs with E2 treatment. Scale bars 50 μm. Representative flow cytometry plots of Ki-67+ ECs, with quantification of Ki-67+ ECs in bone (Vehicle n=4F, n=4M; E2 n=6F, n=4M) indicating an increase in Ki-67+ ECs with E2 treatment. Image quantification data are mean ± s.d. with Two-way ANOVA with Tukey’s test, and flow cytometry data mean ± s.e.m. with Two-way ANOVA with Tukey’s test.
d, Representative confocal images and quantification of Ki-67+ nuclei of Vehicle and E2-treated BECs (Vehicle n=11, E2 n=10) with quantification of average from multiple 20x fields of view indicating an increase in Ki-67+ cells with E2 treatment. Data are mean ± s.d.; Unpaired two-tailed t-test. Scale bars 50 μm
e, Graph showing relative gene expression for angiogenic genes in Vehicle and E2-treated mice, indicating an increase in angiogenesis upon E2 treatment. (Tgfb Vehicle n=8, E2 n=5; Eng Vehicle n=8, E2 n=5; Tie1 Vehicle n=6, E2 n=5; Pecam1 Vehicle n=8, E2 n=5; Itga5 Vehicle n=7, E2 n=5; Flt4 Vehicle n=8, E2 n=5; Flt1 Vehicle n=5, E2 n=4; Fgfr2 Vehicle n=7, E2 n=6; Sox18 Vehicle n=8, E2 n=8; Nrp1 Vehicle n=7, E2 n=6.) Data are mean ± s.e.m.; Multiple Unpaired two-tailed t-test

