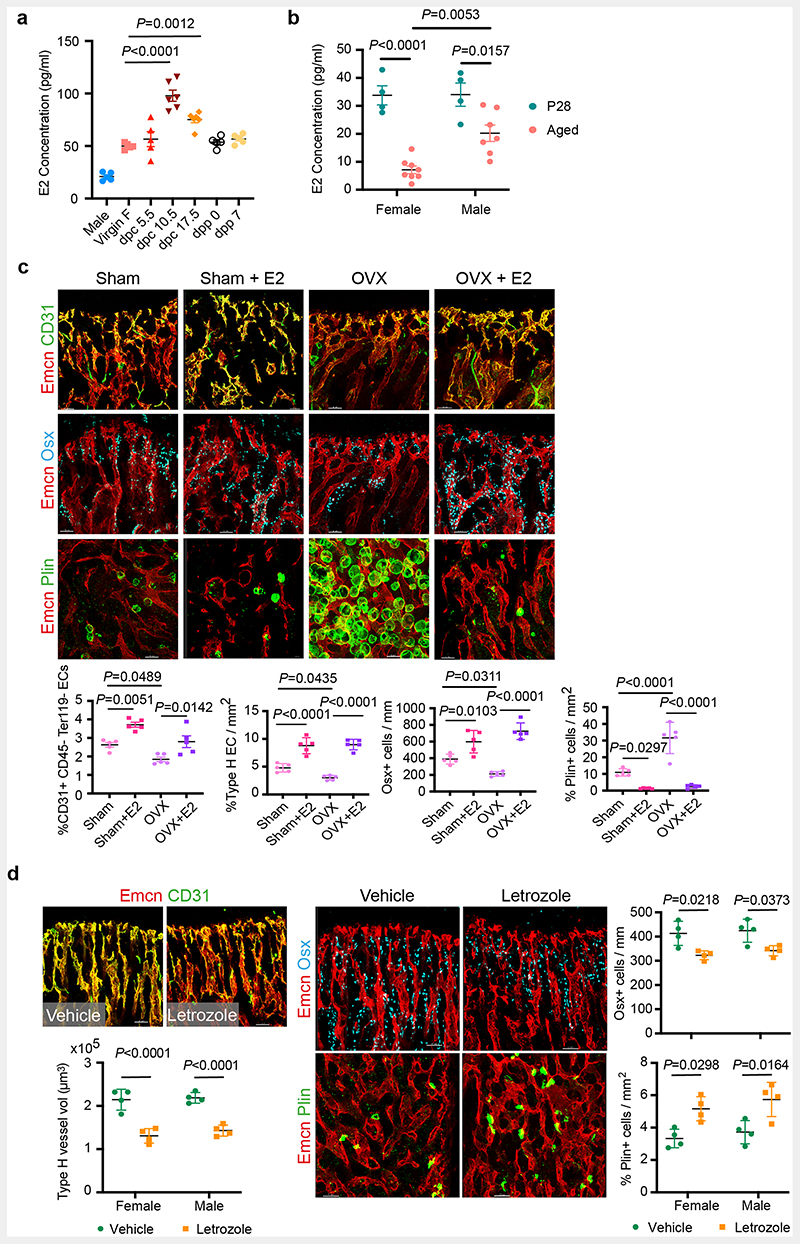
Extended Data Fig. 3. Oestrogen-mediated changes in bone endothelium.
a, Graph showing serum E2 concentration at different time-points during mouse pregnancy (n=6 for dpc10.5, dpc17.5; n=5 for Male, Virgin F, dpc5.5, dpp0, dpp7). Data are mean ± s.e.m.; One-Way ANOVA with Tukey’s test
b, Graph showing serum E2 concentration in P28 (n=4F, n=4M) and aged (n=8F, n=7M) mice. Data are mean ± s.e.m.; Two-Way ANOVA with Tukey’s test
c, Representative confocal images with quantifications of Type-H (yellow, Emcnhigh CD31high) blood vessels (n=5 for all conditions), OBLs (Osterix+, n=5), and BM adipocytes (Perilipin+, n=5) in Vehicle and E2-treated sham-operated and OVX mice. Flow cytometry quantification of total ECs (CD31+CD45-Ter119-) shows the recovery of BECs in E2-treated bones (n=5). Data are mean ± s.d. for image quantification and mean ± s.e.m. for flow cytometry data. Two-Way ANOVA with Tukey’s test. Scale bars 50μm
d, Bone tissue sections of Vehicle and Letrozole-treated mice at P28 were immunostained with CD31 (green) and Emcn (red) to identify type-H vessels. The graph shows quantifications of Type-H (yellow) blood vessels (n=4). The distribution of OBLs and BM adipocytes in these bone sections were imaged using Osterix+ (cyan) and Perilipin (green). Graphs show quantification of OBLs (n=4) and adipocytes (n=4) in Vehicle and Letrozole-treated mice. Data are mean ± s.d.; Two-Way ANOVA with Tukey’s test. Scale bars 50μm

