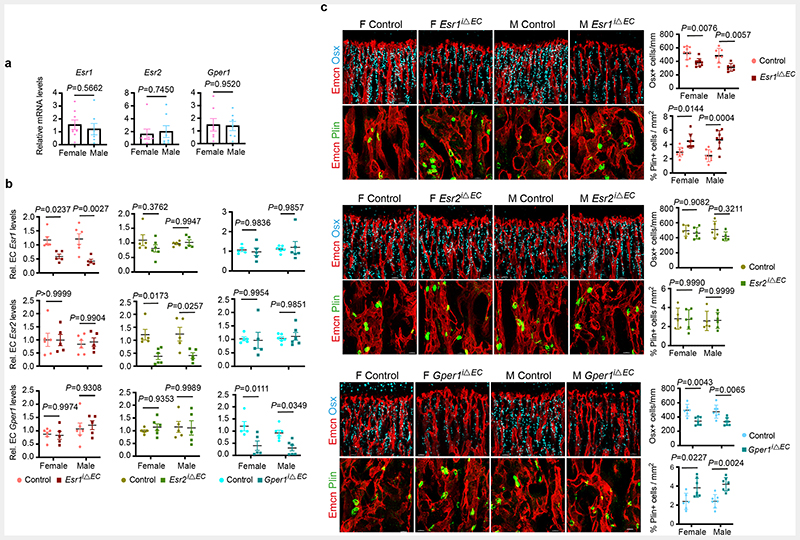
Extended Data Fig. 4. Cellular changes in the bone microenvironment of endothelial-specific oestrogen receptor deletion mutants.
a, Graphs indicating relative mRNA levels of oestrogen receptors (Esr1, Esr2, Gper1) in female and male BECs at P28. (Esr1: n=8F, n=7M; Esr2, Gper1: n=7) Data are mean ± s.e.m.; Unpaired two-tailed t-test
b, Graphs showing ER transcript levels in purified BECs of endothelial Esr1, Esr2, or Gper1 deletion mutant and control littermates (Esr1 Control n=6F, n=6M, Mutant n=5F, n=5M; Esr2 Control n=5F, n=5M, Mutant n=6F, n=5M; Gper1 Control n=5F, n=6M, Mutant n=5F, n=6M). Data are mean ± s.e.m.; Two-Way ANOVA with Tukey’s test
c, Representative confocal images of mutants with endothelial Esr1, Esr2, or Gper1 deletion compared to littermate Cre-controls, with quantifications showing loss of OBLs, and increase in adipocytes after Esr1 and Gper1 deletion (Esr1 :Osx-Control n=10F, n=7M, Mutant n=9F, n=6M; Esr1 :Plin-Control n=9F, n=8M, Mutant n=8F, n=8M; Esr2:Osx-Control n=5F, n=5M, Mutant n=6F, n=5M; Esr2:Plin Control n=5F, n=5M, Mutant n=6F, n=6M; Gper1: both Osx and Plin-Control n=6F, n=7M, Mutant n=7F, n=7M). Data are mean ± s.d.; Two-Way ANOVA with Tukey’s test. Scale bars 40μm

