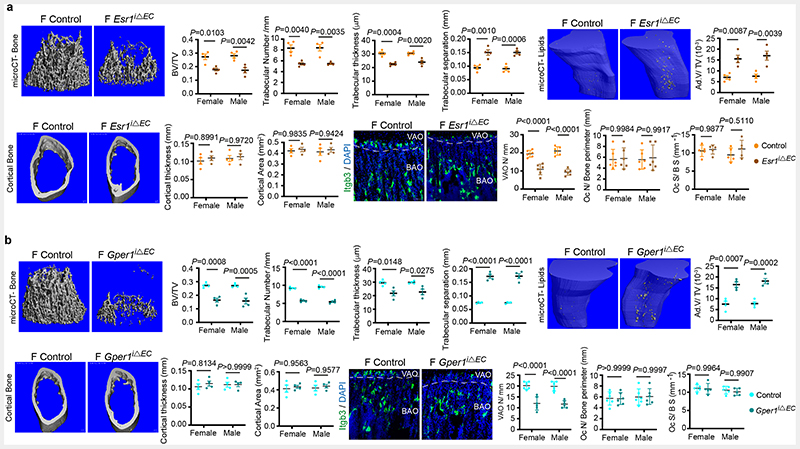
Extended Data Fig. 5. Phenotype analysis of endothelial ER mutants.
a, Representative microCT analysis of mutants with endothelial Esr1 deletion compared to littermate Cre-controls, with quantifications showing trabecular bone volume fraction (BV/TV), number, thickness and separation (n=4), quantification of adipocytes (n=4) and cortical bone quantification of thickness and area (n=4). Representative confocal images show osteoclasts distribution in control and mutant bones with quantification of osteoclasts number (n=6) and coverage (n=5). Data are mean ± s.e.m. for micro-CT results and ± s.d for image quantification; Two-Way ANOVA with Tukey’s test. Scale bars 100μm (microCT), 50μm (confocal)
b, Representative microCT images of mutants with endothelial Gper1 deletion compared to littermate Cre-controls, with quantifications showing trabecular bone volume fraction (BV/TV), number, thickness, and separation (n=4), quantification of adipocytes (n=4) and cortical bone quantification of thickness and area (n=4). Representative confocal images show osteoclasts distribution in control and mutant bones with quantification of osteoclasts number (n=6) and coverage (n=5). Data are mean ± s.e.m. for micro-CT results and ± s.d for image quantification; Two-Way ANOVA with Tukey’s test. Scale bars 100μm (microCT), 50μm (confocal)

