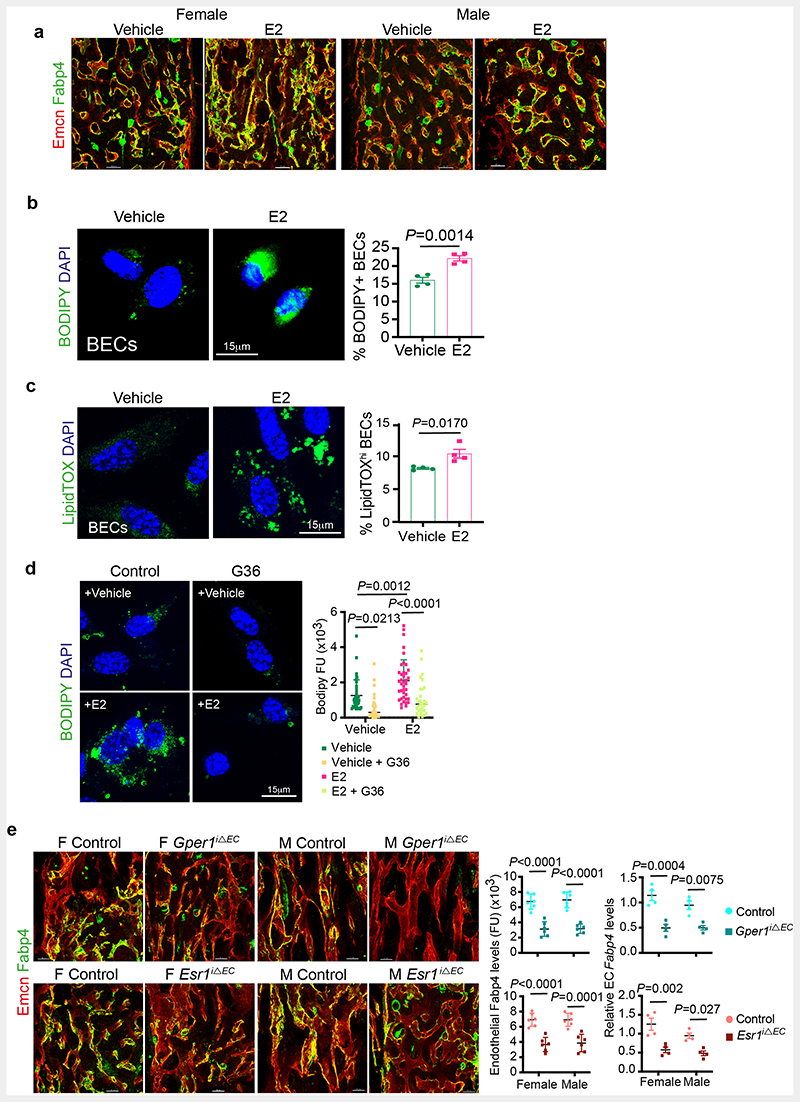
Extended Data Fig. 7. Lipid transport mechanism in BECs.
a, Immunostainings show Fabp4 expression (green) in blood vessels (Emcn, red) of vehicle and E2 treated tibia of both male and female mice (n=7). Scale bars 50μm
b, Representative confocal images of lipid uptake of BODIPY-conjugated synthetic FAs in Vehicle and E2-treated BECs (n=4), with quantification by flow cytometry indicating an increase in lipid uptake with E2 treatment. Data are mean ± s.e.m.; Unpaired two-tailed t-test. Scale bars 15 μm
c, Representative confocal images of intracellular lipid levels in Vehicle and E2-treated BECs. The graph shows flow cytometry quantification of BECs having high LipidTOX (n=4) levels in vehicle and E2 conditions. Data are mean ± s.e.m.; Unpaired two-tailed t-test. Scale bars 15μm
d, Representative confocal images of lipid uptake of BODIPY-conjugated synthetic FAs in Vehicle and E2-treated BECs upon Gper1 inhibitor G36 treatment. Quantification shows reduced fluorescence units of endothelial BODIPY upon Gper1 inhibition, across multiple 63x fields of view (Vehicle n= 37, Vehicle+G36 n= 30; E2 n= 39, E2+G36 n= 30). Data are mean ± s.d.; Two-Way ANOVA with Tukey’s test. Scale bars 15μm
e, Representative confocal images and quantification of endothelial Fabp4 levels in mice with oestrogen-receptor deletions Esr1 (Control n=6F, n=6M; Mutant n=6F, n=6M) and Gper1 (Control n=6F, n=6M; Mutant n=6F, n=6M). Data are mean ± s.d.; Two-Way ANOVA with Tukey’s test. Relative Fabp4 transcript levels were also quantified in purified endothelial cells from endothelial Gper1 (n=4) and Esr1 (n=4) mutants compared to their littermate control. Data are mean ± s.e.m; Two-Way ANOVA with Tukey’s test. Scale bars 50μm

