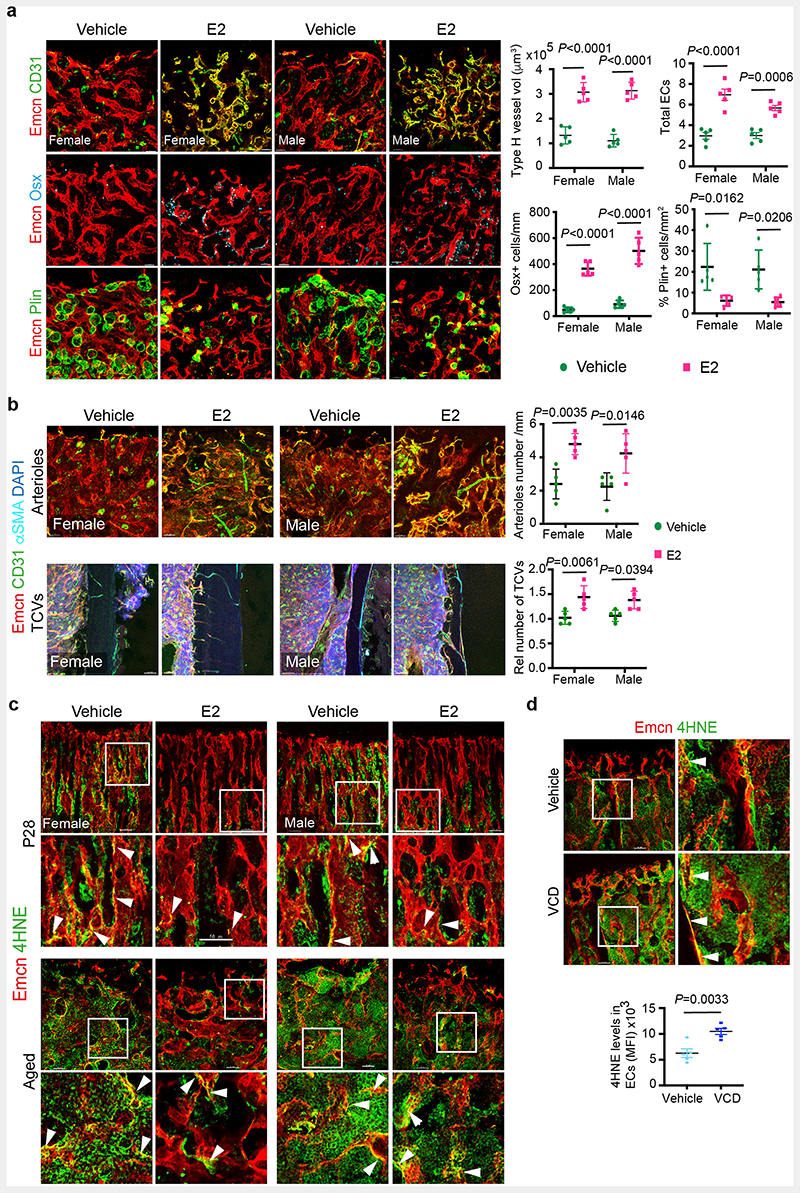
Extended Data Fig. 9. Oestrogen recovers age-related bone loss.
a, Representative confocal images show Type-H vessels (yellow, Emcnhigh CD31high), OBLs (Osterix+) and BM adipocytes (Perilipin+) in aged mice treated with E2 (Vehicle n=5F, n=5M; E2 n=5F, n=5M). Scale bars 40μm. Graphs show quantification of total ECs, type-H vessels, Osx+ and Perilipin+ cells in bones of vehicle and E2 treated mice. Data are mean ± s.e.m. for flow cytometry data and mean ± s.d. for image quantification, Two-Way ANOVA with Tukey’s test
b, Confocal images of bone sections immunostained for CD31 (green), endomucin (red), alpha-smooth muscle actin (αSMA, cyan) show distribution of CD31+ Emcn-arterioles and TCVs in aged mice treated with Vehicle and E2. Quantification graphs show an increase in arterioles and TCVs (n=5) after E2 administration in mice; Data are mean ± s.d.; Two-way ANOVA with Tukey’s test. Scale bars 50μm (arterioles), 100μm (TCVs)
c, Representative confocal images of 4HNE levels in bone endothelium of vehicle and E2-treated young (P28; n=8) and aged (>60 weeks; n=4) mice. Images show inset depicting endothelial expression of 4HNE illustrated by arrowheads. Scale bars 50μm
d, VCD menopause model with insets indicating endothelial expression of 4HNE illustrated by arrowheads (Vehicle n=5; VCD n=5). Data are mean ± s.d.; Unpaired two-tailed t-test. Scale bars 50μm

