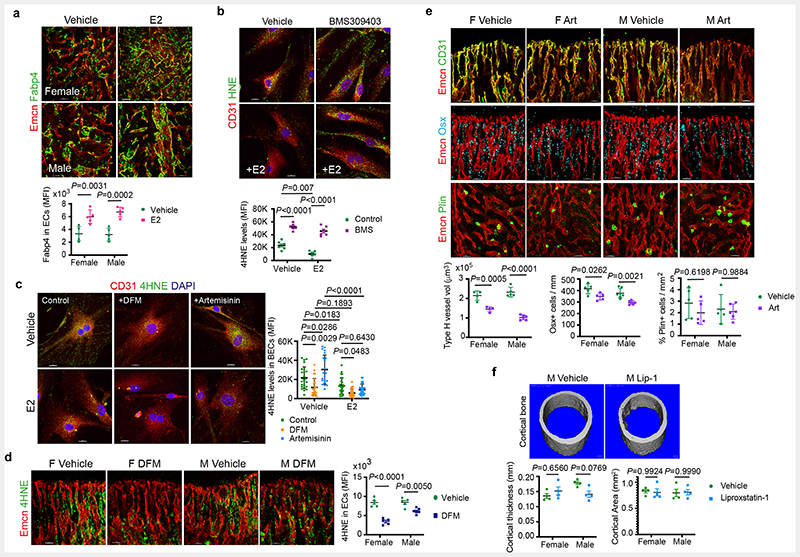
Extended Data Fig. 10. Oestrogen recovers age-related bone loss.
a, Representative confocal images of endothelial Fabp4 expression in aged mice (n=5), showing an increase after E2 treatment. Data are mean ± s.d.; Two-Way ANOVA with Tukey’s test. Scale bars 50μm
b, Representative confocal images with quantification of 4HNE levels in bone endothelial cells treated with vehicle and FABP4 inhibitor BMS 309403 in the presence of E2. Quantification showed high 4HNE levels upon Fabp4 inhibition, which was not recovered by E2 treatment (n= 6). Data are mean ± s.d.; Two-Way ANOVA with Tukey’s test. Scale bars 15μm
c, Representative confocal images of BECs treated with Control, Deferoxamine (DFM) or Artemisinin (Art). Graph shows quantification of fluorescence intensity of endothelial 4HNE levels (Vehicle n= 24, E2 n=26; Vehicle+DFM n=26; E2+DFM n=27; Vehicle+Art n=21; E2+Art n=23) Data are mean ± s.d.; Two-Way ANOVA with Tukey’s test. Scale bars 15μm
d, Representative confocal images with quantification of 4HNE levels in bone endothelium of vehicle (n=5F, n=5M) and DFM-treated mice (n=5F, n=6M) at P28. Data are mean ± s.d.; Two-Way ANOVA with Tukey’s test. Scale bars 50μm
e, Confocal images show type-H vessels, OBLs and perilipin expression in BM microenvironments of mice treated with Artemisinin (Art). Graphs showing quantification of Type-H vessel volume per field of mp (Vehicle n=4F, n=5M; Artemisinin n=4F, n=6M), Osterix+ cells per mm of mp (Vehicle n=5F, n=7M; Artemisinin n=5F, n=6M), and Perilipin+ area per mp area (Vehicle n=5F, n=5M; Artemisinin n=5F, n=6M). Data are mean ± s.d. Two-Way ANOVA with Tukey’s test. Scale bars 50μm
f, Representative microCT 3D-rendered images show cortical bones of aged male mice treated with vehicle and Liproxstatin-1 (Lip-1). Graphs show cortical bone thickness (in mm) and cortical bone area of aged male and female mice treated with vehicle (n=4F, 4M) and Liproxstatin-1 (n=4F, 4M). Data are mean ± s.e.m.; Two-Way ANOVA with Tukey’s test. Scale bars 100μm

