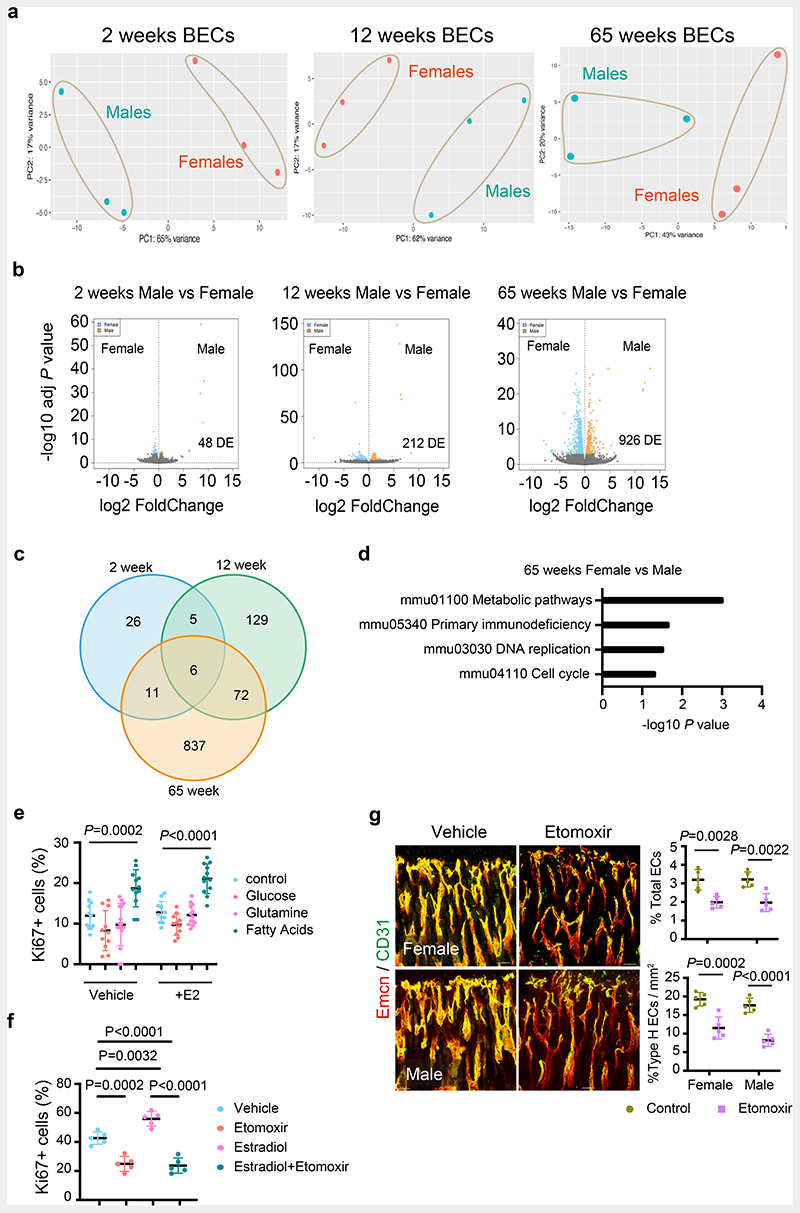
Fig. 3. Metabolic regulation of BECs.
a, PCA plots of RNAseq data showing clustering by sexes in BECs from 2 weeks, 12 weeks, and 65 weeks old mice (n=3).
b, Volcano plots show the number of significant FDR-corrected (Bonferroni) P-values (Padj<0.01) differentially expressed (DE) genes versus log2 fold change between female and male bone endothelial cells of 2 weeks, 12 weeks, and 65 weeks old mice. DE genes were obtained by fitting each gene to a generalized linear model followed by hypothesis testing using the Wald test.
c, Venn diagram showing the overlap in differentially expressed genes between males and female bone endothelial cells of 2 weeks, 12 weeks, and 65 weeks old mice.
d, Generally Applicable Gene-set Enrichment for Pathway Analysis (GAGE) for differentially expressed genes in RNAseq data showing biological processes that differ between aged male and female BECs. Gene data sets of metabolic pathways, cell cycle and DNA are upregulated, and primary immunodeficiency pathway genes are downregulated. The significance of enrichment was calculated using 2-sample t-tests, and the significant KEGG terms were selected using a P-value < 0.05.
e, Graph showing quantification of Ki-67+ cultured BECs in the nutrient-free medium supplemented with glucose, glutamine or fatty acids, with vehicle (Control n=9, Glucose n=11, Glutamine n=15, Fatty acids n=12) and E2 treatment (Control n=11, Glucose n=11, Glutamine n=13, Fatty acids n=12); data are mean ± s.d; Two-Way ANOVA with Tukey’s test
f, Graph showing quantification of Ki-67+ cultured BECs treated with Vehicle or E2, with or without Etomoxir treatment (n=5); data are mean ± s.d; Two-Way ANOVA with Tukey’s test
g, Representative confocal images of Type-H (Emcnhigh CD31high) vessels in Vehicle and Etomoxir-treated mice; quantification of type-H ECs normalised to the area of the metaphysis (mp) (n=5); Data are mean ± s.d.; Unpaired two-tailed t-test. Total ECs (CD31+ CD45-Ter119-) quantified by flow cytometry (n=5); Data are mean ± s.e.m.; Unpaired two-tailed t-test. Scale bars 50μm.

