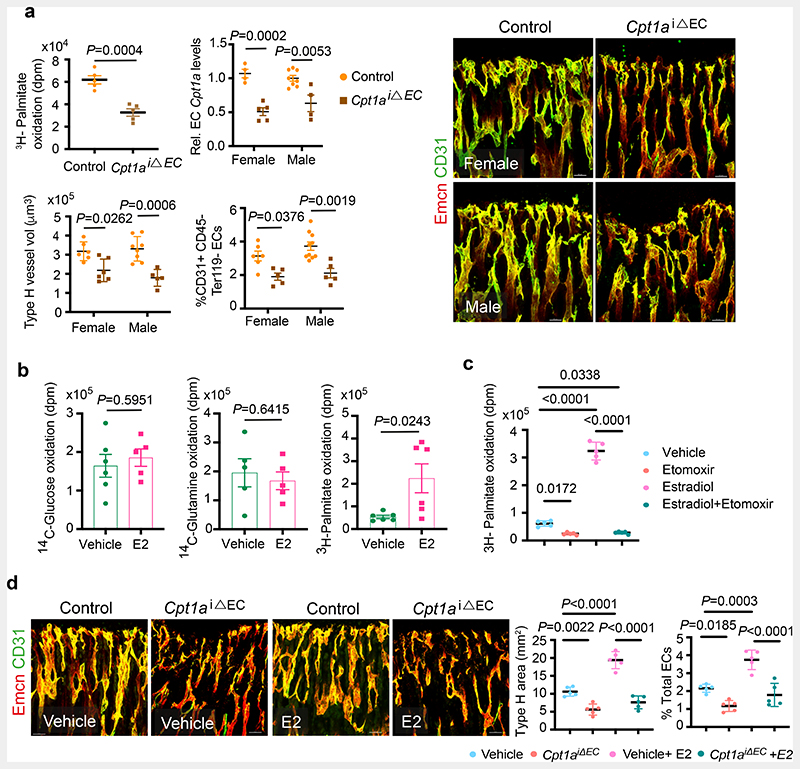
Fig. 4. Oestrogen-mediated bone endothelial growth is supported by fatty acids.
a, Graph showing oxidation of 3H-labelled Palmitate by control and Cpt1a deleted BECs.
Graph shows Cpt1a mRNA levels in purified BECs from control and Cpt1a iΔEC mutant bones.
Representative confocal images of Type-H (Emcnhigh CD31high) vessels in control and endothelial Cpt1a deletion mutants, with quantification of type-H blood vessel volume (Control n=6F, n=8M; Mutant n=6F, n=5M) and total ECs (CD31+ CD45-Ter119-) characterised by flow cytometry (Control n=6F, n=5M; Mutant n=10F, n=5M); Data are mean ± s.d. for image quantification (type-H volume) and mean ± s.e.m for H-Palmitate, flow cytometry and qPCR data; Two-Way ANOVA with Tukey’s test performed except 3H-Palmitate data (Unpaired two-tailed t-test). Scale bars 40μm.
b, Graphs showing Glucose (Vehicle n=6, E2 n=5), Glutamine (Vehicle n=5, E2 n=5) and Palmitate (Vehicle n=6, E2 n=6) oxidation in Vehicle and E2-treated BECs, measured by radioactivity (disintegrations per minute, dpm). Data are mean ± s.e.m.; Unpaired two-tailed t-test
c, Graph showing palmitate oxidation by BECs treated with Vehicle or E2, with or without Etomoxir treatment (n=5); data are mean ± s.e.m; Two-Way ANOVA with Tukey’s test
d, Representative confocal images depicting Type-H (Emcnhigh CD31high) vessels in control and Cpt1a iΔEC mutant mice treated with E2. Scale bars 50μm. Quantifications show Type-H vessel ECs normalised to the area of mp (Control n=5F, n=5M; Mutant n=5F, n=5M) and Total ECs (CD31+ CD45-Ter119-) quantified by flow cytometry (Control n=5F, n=5M; Mutant n=5F, n=5M). Data are mean ± s.d. for image quantification and mean ± s.e.m for flow cytometry data; Two-Way ANOVA with Tukey’s test

