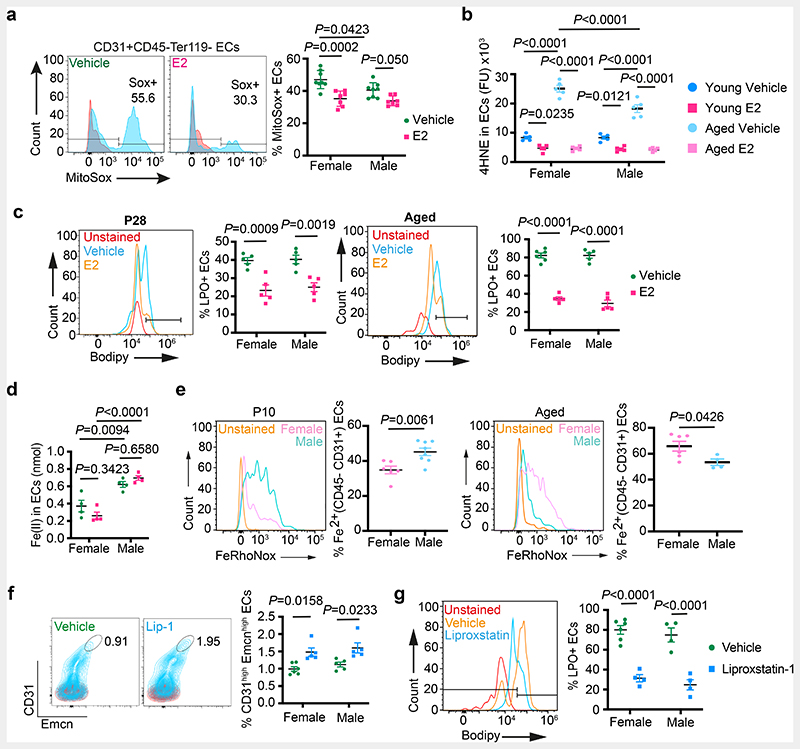
Fig. 6. Defective lipid metabolism promotes vascular ageing in bones.
a, Representative flow cytometry plots of ROS generation in ECs from Vehicle (n=8F, n=8M) and E2-treated (n=7F, n=7M) mice. Red peaks in the histogram plots indicate unstained cells. Quantifications show a reduction in ROS upon E2 treatment. Data are mean ± s.e.m.; Two-Way ANOVA with Tukey’s test
b, Quantifications of 4HNE levels in ECs from immunostaining in young Vehicle (n=5F, n=5M) and E2-treated (n=5F, n=5M) mice; and aged Vehicle (n=5F, n=5M) and E2-treated (n=5F, n=5M) mice showing a reduction in 4HNE levels upon E2-treatment. Data are mean ± s.d.; Two-Way ANOVA with Tukey’s test
c, Representative flow cytometry plots of Lipid peroxide (LPO) generation in ECs from young Vehicle (n=5F, n=5M) and E2-treated (n=5F, n=5M), and aged Vehicle (n=6F, n=5M) and E2-treated (n=5F,n=5M) mice. Red peaks in the histogram plots indicate unstained cells. Quantifications show a reduction in LPO upon E2 treatment. Data are mean ± s.e.m.; Two-Way ANOVA with Tukey’s test
d, Graph showing sex differences in intracellular ferrous ion concentrations in BECs of Vehicle and E2-treated mice (n=4). Data are mean ± s.e.m.; Two-Way ANOVA with Tukey’s test
e, Representative flow cytometry plots with quantifications showing sex differences in intracellular ferrous ions in BECs at P10 (n=6F, n=8M) and aged (n=6F, n=4M) mice. Data are mean ± s.e.m.; Unpaired two-tailed t-test
f, Representative flow cytometry plots with quantifications showing increase in Type-H ECs (CD31high Emcnhigh) with Liproxstatin-1 (Lip-1) treatment in aged mice (Vehicle n=6F, n=5M; Lip-1 n=5F, n=5M). Data are mean ± s.e.m.; Two-Way ANOVA with Tukey’s test
g, Representative flow cytometry plots of BEC populations of aged Vehicle and Lip-1-treated mice. Quantifications are of ECs with lipid ROS (Vehicle n=6F, n=4M; Lip-1 n=4F, n=4M), indicating a reduction upon Lip-1 treatment. Red peaks in the histogram plots indicate unstained cells. Data are mean ± s.e.m.; Two-Way ANOVA with Tukey’s test

