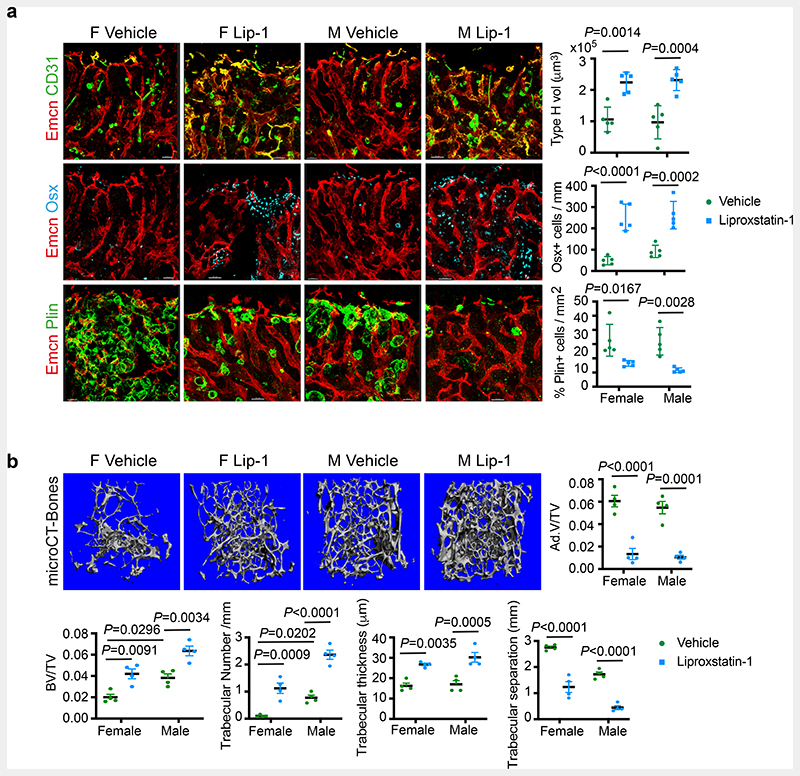
Fig. 7. Liproxstatin-1 protects against age-related bone loss.
a, Representative confocal images of BM microenvironment in aged mice treated with Liproxstatin-1 (Lip-1), with graphs showing quantification of Type-H vessel volume per field of mp (Vehicle n=5F, n=5M; Liproxstatin-1 n=5F, n=5M), Osterix+ cells per mm of mp (Vehicle n=5F, n=5M; Liproxstatin-1 n=5F, n=5M), and Perilipin+ area per mm area (Vehicle n=5F, n=5M; Liproxstatin-1 n=5F, n=5M). Data are mean ± s.d.; Two-Way ANOVA with Tukey’s test. Scale bars: 40μm (vehicle), 50μm (Liproxstatin-1).
b, Representative microCT images of bones from aged mice treated with Liproxstatin-1, with graphs showing quantification of trabecular bone volume, number, thickness and separation (n=4) and adipocyte volume (n=4). Data are mean ± s.e.m.; Two-Way ANOVA with Tukey’s test.

