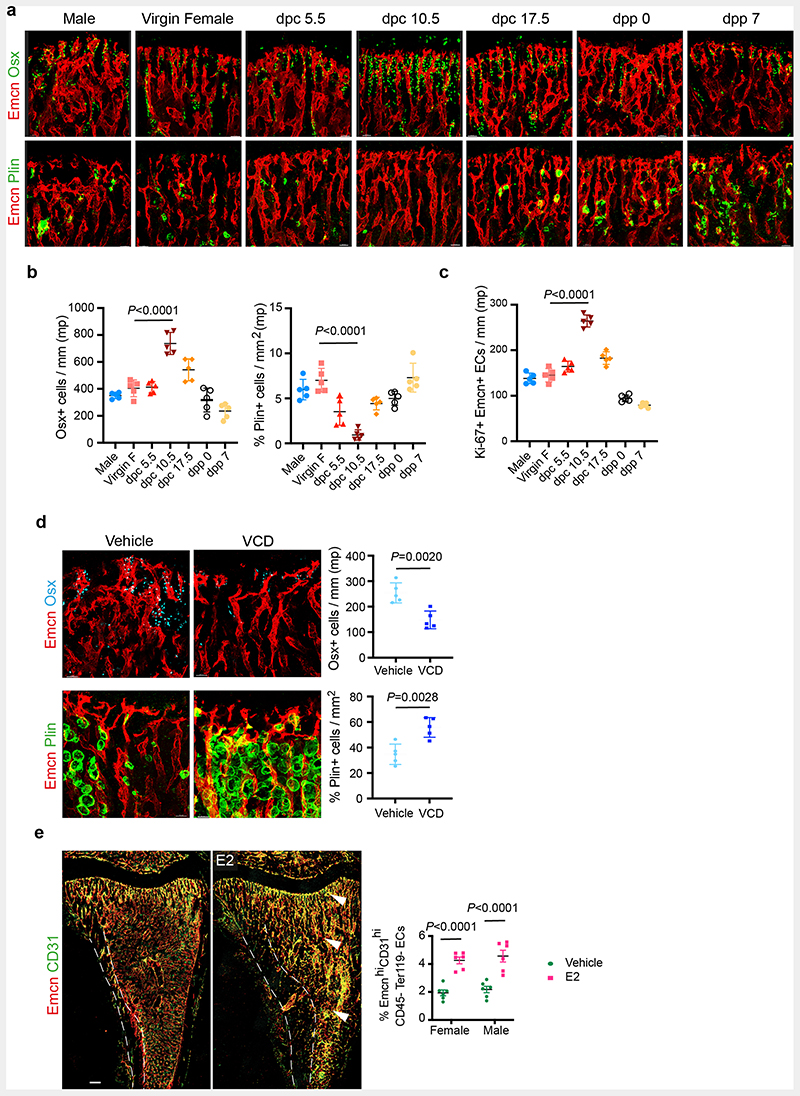
Extended Data Fig. 1. Changes in the frequency of OBLs and adipocytes during pregnancy and menopause.
a, Representative confocal images showing changes in OBLs (Osterix+) and bone marrow (BM) adipocytes (Perilipin+) at different time-points during mouse pregnancy and post-partum. Scale bars 40 μm.
b, Quantification of OBLs and BM adipocytes described in a, normalised to metaphysis (mp) length and area respectively (n=5). Data are mean ± s.d.; One-Way ANOVA with Tukey’s test
c, Quantification of Ki-67+ ECs at different time-points during mouse pregnancy, normalised to the length of mp (n=5). Data are mean ± s.d.; One-Way ANOVA with Tukey’s test
d, Representative confocal images with quantifications (n=5) showing loss of OBLs, and increase in BM adipocytes in the VCD model. Data are mean ± s.d.; Unpaired two-tailed t-test. Scale bars 40 μm.
e, Representative confocal tile scans of Vehicle and E2-treated bones at P28, illustrating increased Type-H vessels (arrowheads) in E2-treated mice. White dotted lines separate bone marrow from the cortical bone region. Quantification of Type-H ECs (CD31high Emcnhigh) characterised by flow cytometry (n=6). Data are mean ± s.e.m.; Two-way ANOVA with Tukey’s test. Scale bars 100 μm.

