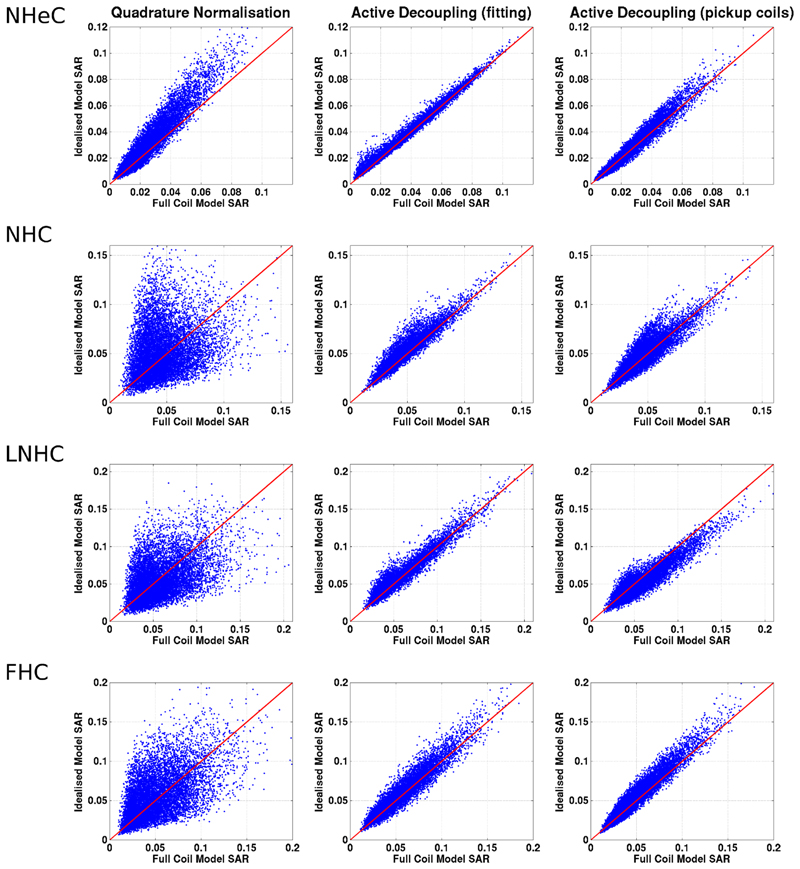
FIG. 6.
Maximum local 10 g SAR predictions from the Idealized Coil Model plotted against the predictions from the Full Coil Model. Each blue dot corresponds to a single random RF shim; the red line indicates equality. The rows correspond to different voxel models, while the columns correspond to different decoupling settings applied to the FCM (abbreviations listed in Table 1).

