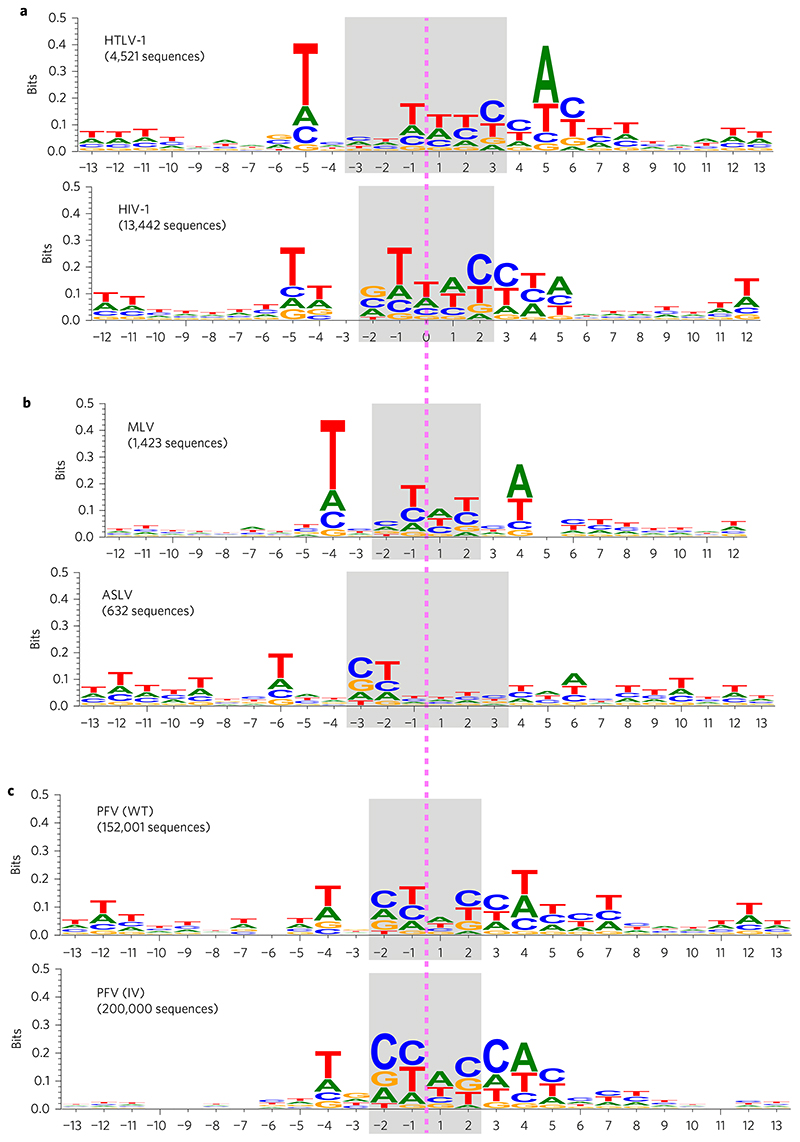
Figure 3. Summary of results from fitting the two-component mixture model by maximum likelihood.
a, Sequence logo summaries of one of the two subpopulations of integration site sequences in the HTLV-1 and HIV-1 data sets (in each case, the other subpopulation is characterized by the reverse complement of the sequence logo shown). b, As in a, but for the MLV and ASLV data sets. c, As in a, but for the PFV (WT) and PFV (IV) data sets.

