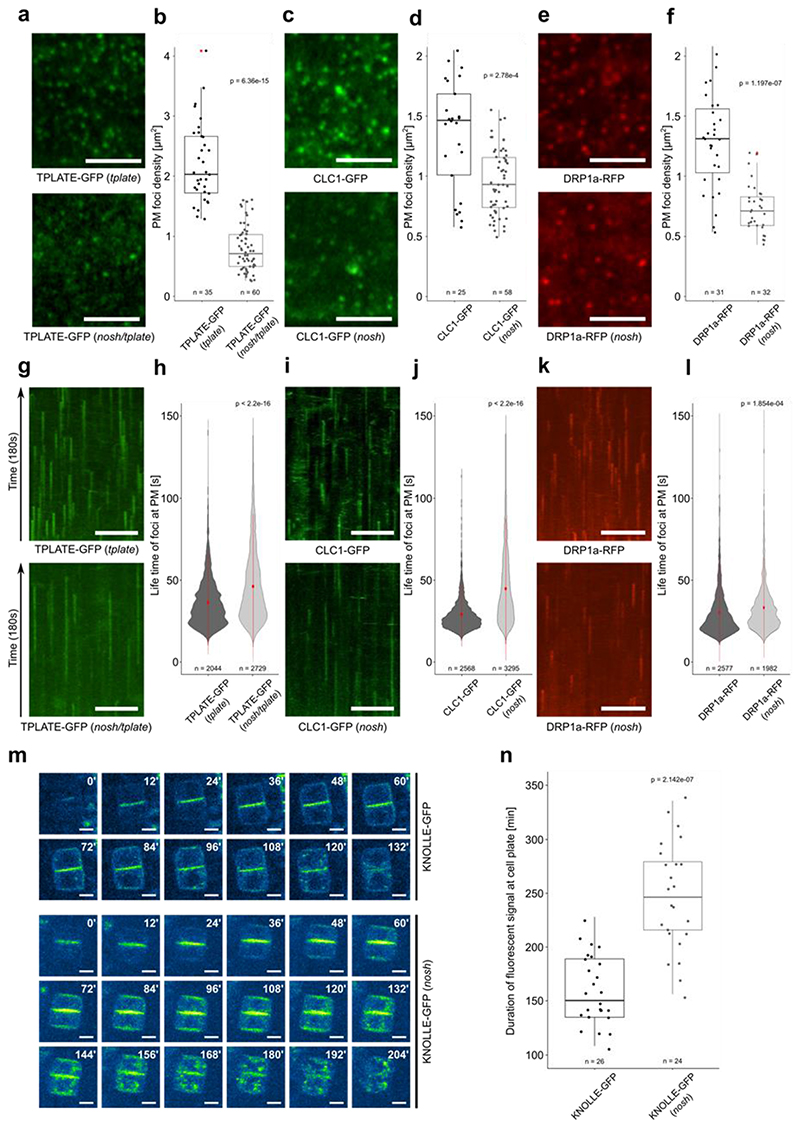
Figure 2. nosh is defective in endocytosis.
a-f) Representative single slice spinning disk images and box plot quantifications of TPLATE-GFP, CLC1-GFP and DRP1a-RFP densities in dark grown hypocotyl epidermal cells of control (top row) and nosh (bottom row) backgrounds. For each marker, the endocytic foci density is significantly reduced in nosh. Numbers of quantified cells (with 2 cells analyzed per individual seedling) are indicated. Red asterisks mark the outliers. Scale bar = 5 μm. g-l) Representative kymographs and violin plot graphs of spinning disk time lapses (from a, c, e) showing increased average life-time at PM for TPLATE-GFP, CLC1-GFP and DRP1a-RFP in nosh compared to the controls. The number of events analyzed for each independent line is indicated at the bottom of each graph. At least 12 movies from 6 seedlings were imaged and analyzed for each independent transgenic line. Red circles represent the mean and the red line represents the standard deviation. Scale bar = 50 μm. m) Single frame images of a root tracking time lapse of KNOLLE-GFP in Col-0 and nosh. Numbers in the upper right corner represent the relative time in minutes. KNOLLE-GFP displayed prolonged cell plate localization and overall cellular presence post cytokinesis in nosh. Scale bar = 5 μm. n) Box plot graph showing the duration of cell plate localization of KNOLLE-GFP. Numbers of quantified cells from independent seedlings (≥ 6 cells per seedling) are indicated. The top and bottom lines of the box plots represent the 25th and 75th percentiles, the center line is the median and whiskers are the full data range. The widest part of the violin plot represents the highest point density, whereas the top and bottom are the maximum and minimum data respectively. The indicated p-values (panels b, d, f, h, j, l and n) were calculated using the two-sided Wilcoxon-signed rank test by comparing mutant to control.

