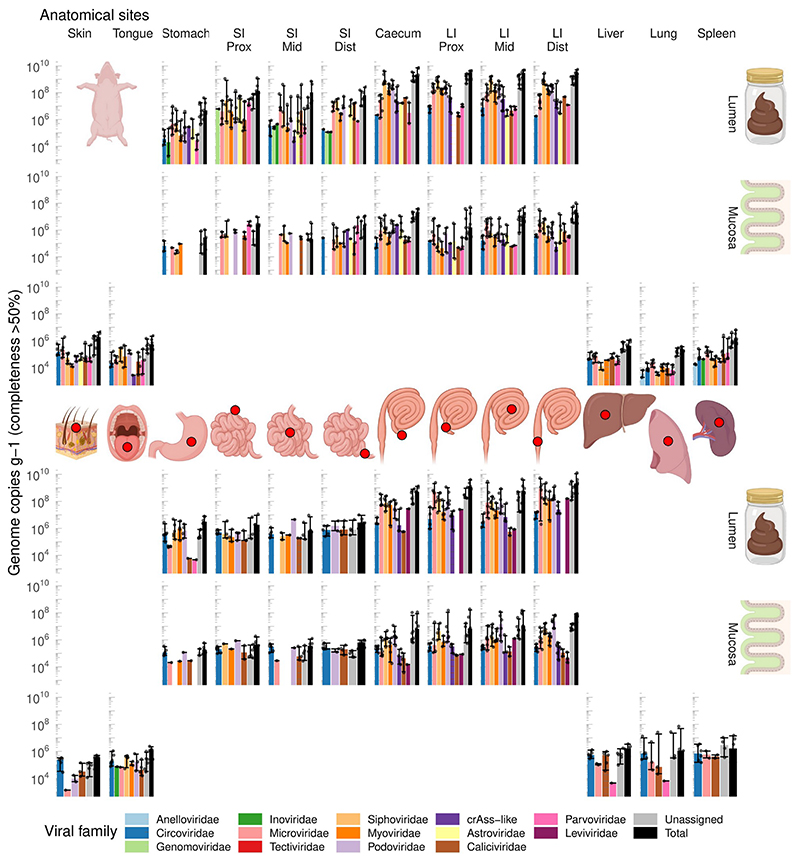
Fig. 1. Abundance of different viral families along the GIT and in parenchymal organs of domestic pigs (A, n=6) and rhesus macaques (B, n=6).
SI, small intestine; LI, large intestine; Prox/Mid/Dist, proximal, medial and distal portions, respectively. Absolute abundance of viral genomes was calculated by comparing coverage with that of the spike-in standard (phage Q33). Only genomes with >50% of estimated completeness were taken into account when calculating viral loads. Bar heights correspond to median values across six animals of each species, error bars denote interquartile ranges. Rows of plots in each of panel A and B are tissue types (top to bottom: lumen, mucosa, and skin/parenchyma). Columns of plots are anatomical sites. Middle portion of the figure shows schematic locations of sampled anatomical sites.

