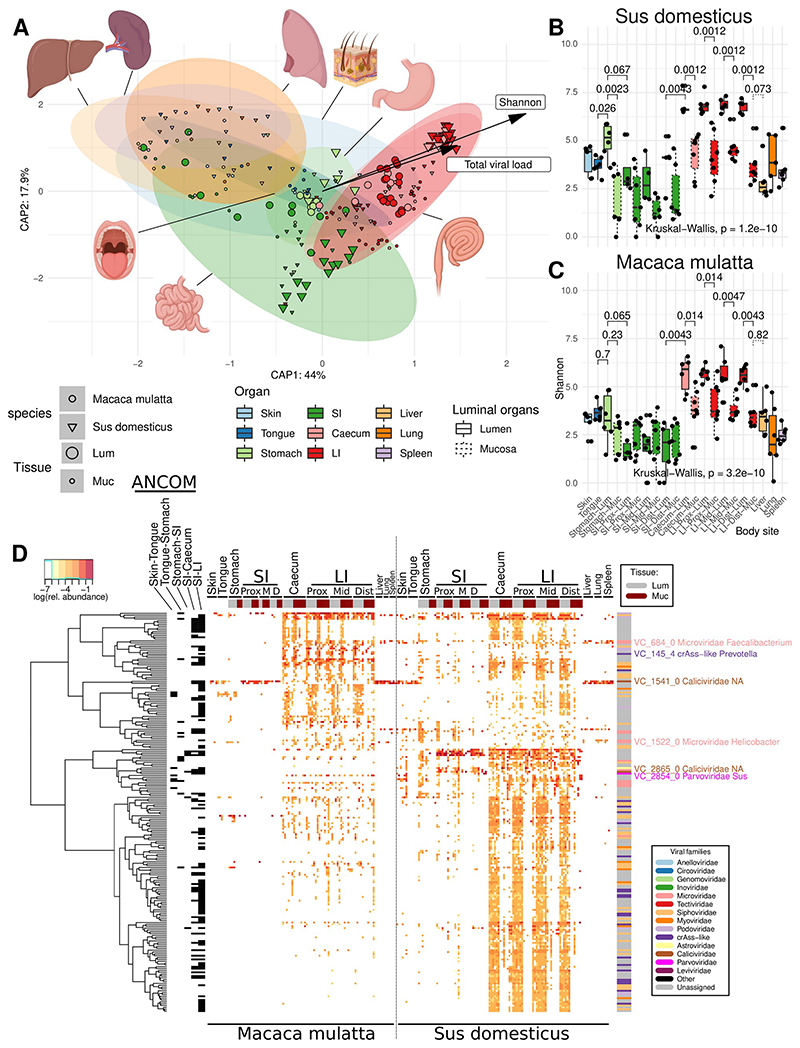
Fig. 2. α- and β-Diversity of viromes in various anatomical sites in domestic pigs (n=6) and rhesus macaques (n=6).
A, Canonical analysis of principal coordinates (CAPSCALE) of Bray-Curtis dissimilarities between virome samples, based on fractional VC counts; anatomical locations, Shannon diversity index and total viral load used as constraining explanatory variables (vectors are only shown for the latter two); ellipses represent 95% confidence regions (see colour legend below, common with panels B and C); B and C, Shannon diversity index calculated with read counts for individual viral genomic contigs (pigs and macaques, respectively); SI, small intestine; LI, large intestine; Prox/Mid/Dist, proximal, medial and distal portions, respectively; organ colours are matched with those in panel A, dashed boxplots represent mucosal sites; boxplots are standard Tukey type with interquartile range (box), median (bar) and Q1 – 1.5 × IQR/Q3 + 1.5 × IQR (whiskers); D, VCs differentially abundant between organs selected using ANCOM-II test (p < 0.05 after Benjamini-Hochberg correction); rows represent VCs, columns – sites in individual animals; a series of post-hoc tests identified VCs (annotated with black bricks) discriminatory between the following anatomic locations: Skin-Tongue, Tongue-Stomach, Stomach-SI, SI-Caecum, and SI-LI; the top and the right-hand side annotation bars represent tissue types (lumen vs mucosa) and viral families of VCs respectively; tree represents hierarchical clustering of VCs based on relative abundance patterns. An expanded version of this panel is provided as supplementary Fig. 5.

