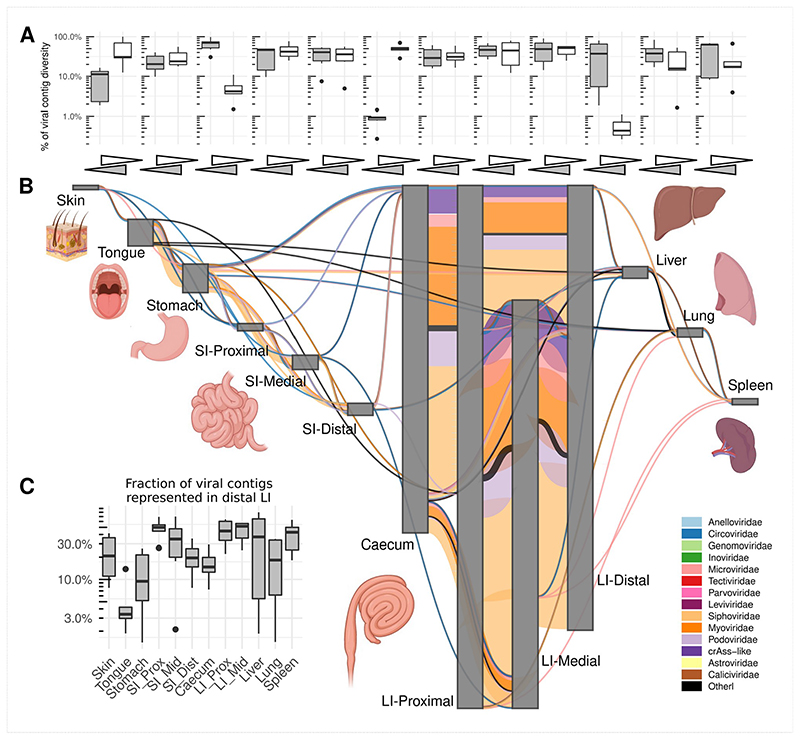
Fig. 4. Sharing of viral genomic contigs between different anatomical sites in macaques (n=6).
A, fraction of viral contig diversity shared between pairs of sites in both directions (white arrows/boxplots are forward direction, grey are reverse), in the order indicated in panel B; Boxplots are standard Tukey type with interquartile range (box), median (bar) and Q1 – 1.5 × IQR/Q3 + 1.5 × IQR (whiskers). B, aggregated map of viral contig sharing across six animals; vertical grey rectangles height is proportional to viral richness (individual genomic contig counts) at each location, aggregated across luminal and mucosal samples; thickness of coloured connectors is proportional with the number of genomic contigs of each viral family shared between pairs of locations; SI, small intestine; LI, large intestine; Prox/Mid/Dist, proximal, medial and distal portions, respectively; unclassified genomic contigs were excluded; C, fraction of viral contig diversity from each organ represented in the distal LI; Boxplots are standard Tukey type as above.

