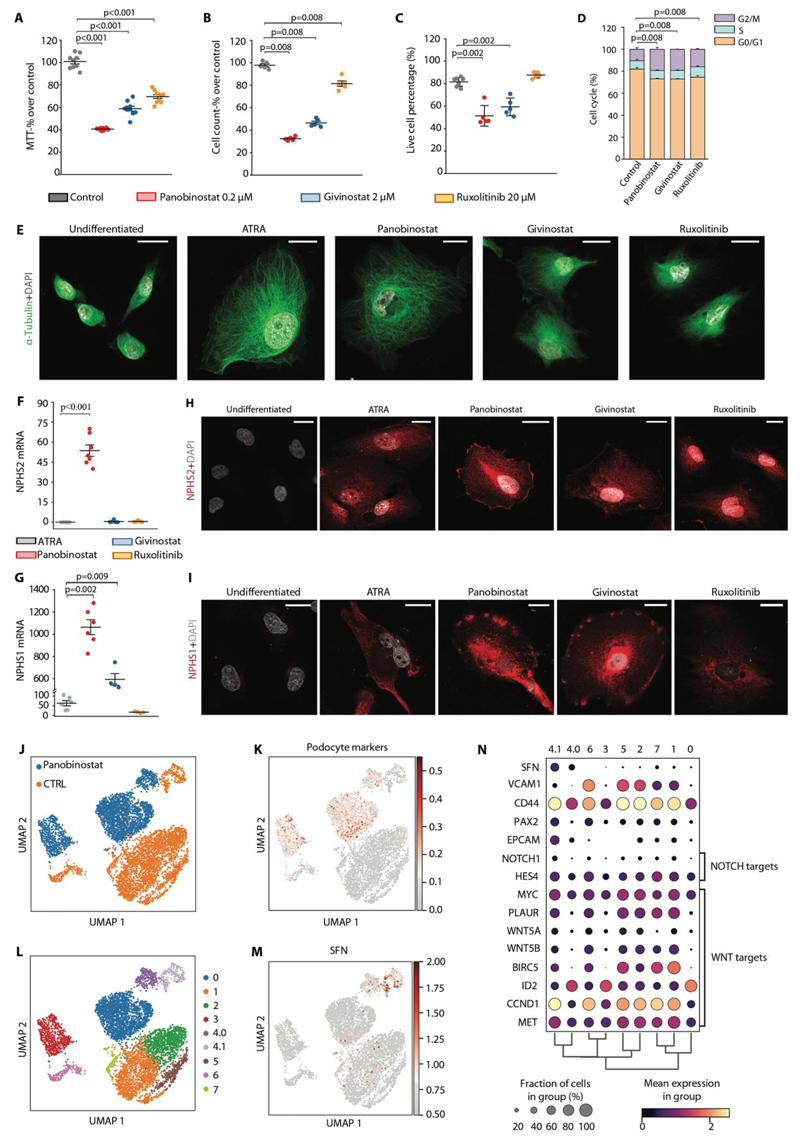
Fig. 6. Panobinostat inhibits RPC proliferation and promotes their differentiation also in humans.
(A-I) In vitro drugs screening on RPC following 48 hours stimuli with panobinostat, givinostat and ruxolitinib. Each dot represents the mean of technical triplicates. (A) MTT assay on primary human RPC treated with panobinostat, givinostat and ruxolitinib for 48 hours. Data were obtained from 3 different primary cultures in 3 independent experiments. (B) Cell count following 48 hours treatment. Data were obtained from 3 different primary cultures in 2 independent experiments. (C) Quantification of live cells of Annexin-V/Propidium Iodide FACS staining for assessment of apoptosis induction after treatment with the three compounds. Data were obtained from 3 different primary cultures in 3 independent experiments. (D) Distribution of RPCs in cell cycle phases assessed by flow cytometry. Data were obtained from 3 different primary cultures in 2 independent experiments. (E) Representative STED images showing cytoskeleton changes based on tubulin expression after treatment with the three compounds. Untreated cells and ATRA treated cells were used as negative and positive control, respectively. One representative of 3 independent experiments is shown. DAPI counterstains nuclei (white). Bars=20 μm. (F, G) Podocyte marker expression in RPCs after treatment with ATRA, panobinostat, givinostat and ruxolitinib. mRNA expression of NPHS2 (F) and NPHS1 (G) were determined by real-time RT-PCR and reported as fold increase over untreated cells. Data were obtained from 3 different primary cultures in 3 independent experiments. (H, I) Representative confocal microscopy images showing expression of podocyte markers (NPHS2 and NPHS1 in red) following treatment with the three compounds. Untreated and ATRA treated cells were used as negative and positive control, respectively. One representative of 3 independent experiments is shown. DAPI counterstains nuclei (white). Bars=25 μm. (J) UMAP projection of control and panobinostat treated PEC culture scRNAseq dataset splitted by sample. (K) UMAP visualization of podocyte markers expression. (L) UMAP projection of control and panobinostat treated PEC culture scRNAseq dataset splitted by clusters. (M) UMAP visualization of stratifin expression. (N) Dot plot showing the expression of genes related to crescent, NOTCH or WNT pathways affected by panobinostat treatment.
In dot plots (A-C, F and G), bars indicate mean values. Individual scores are shown. Statistical significance was calculated by Mann-Whitney test; numbers on graph represent p-values. MTT, 3-(4,5-dimethylthiazol-2-yl)-2,5-diphenyltetrazolium bromide; ATRA, all-trans retinoic acid; DAPI, 4',6-diamidino-2-phenylindole; NPHS2, podocin; NPHS1, nephrin, UMAP, uniform manifold approximation and projection; SFN, stratifin.

