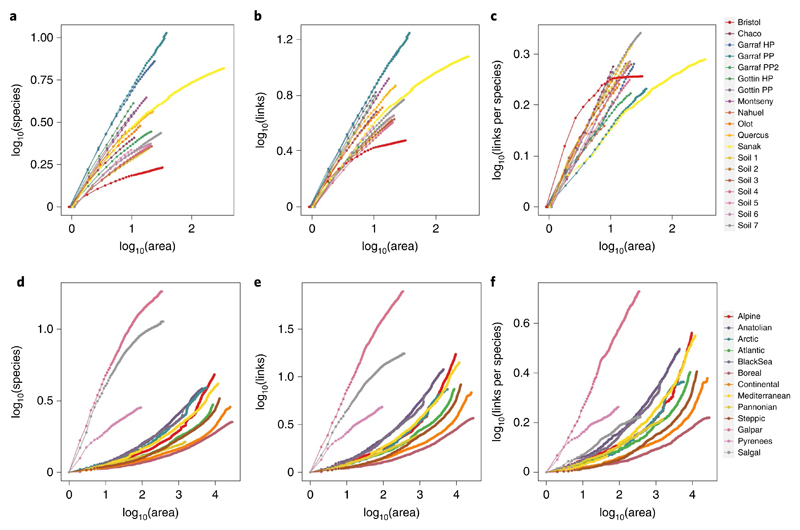
Fig. 1. Spatial scaling of network complexity.
a–f, The relationship of species (a,d), links (b,e) and links per species (c,f) with area for regional (a–c) versus biogeographical (d–f) networks. For each dataset, each point represents the mean value of the analysed network property across the total amount of replicates in the aggregation procedure for a given area. For all datasets, all network properties have been rescaled to start at 0 for visualization purposes. In the biogeographical domain, three datasets show a linear-concave increase of the number of species, network links and links per species with area, similar to those observed in the regional domain; these differences may be explained by differences in sampling methods among datasets (Methods and Supplementary Text 1).

