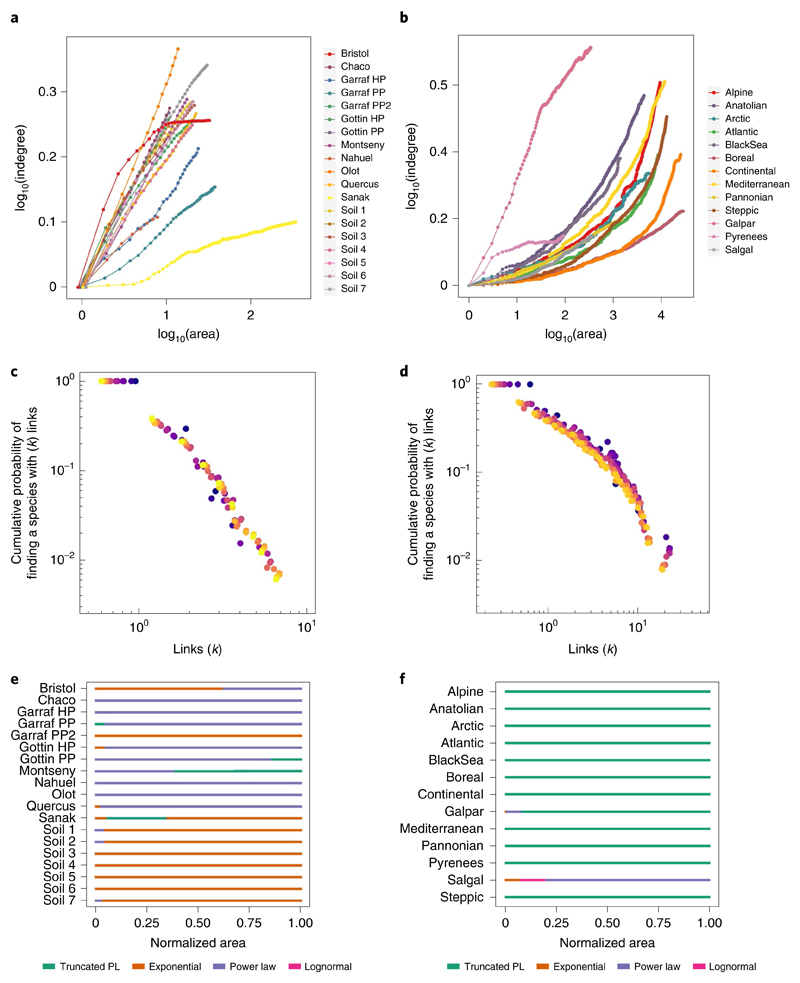
Fig. 3. Spatial scaling of mean indegree and network degree distribution.
a,b, The mean number of resources per consumer (mean indegree) increases with area within both regional (a) and biogeographical (b) spatial domains. Each point represents the mean value across every replicate in the aggregation procedure at a given area. Note that for visualization purposes, all x and y values in all datasets have been rescaled to start at 0. The shape of the network degree distributions is consistent across area at both regional and biogeographical domains. c,d, Two datasets are shown as illustration: Garraf-PP (c, regional) and Galpar, (d, biogeographical) (Supplementary Text 1). The cumulative probabilities of finding a species in the network that has k links to resources in the network are normalized by the mean number of links per species in the network. One replicate for a subset of areas is shown for each dataset to facilitate visualization. Each colour represents network degree distribution for a given area, from dark blue, representing the smallest area (1 spatial unit), to yellow, representing the largest area for each dataset (40 spatial units for Garraf-PP and 373 spatial units for Galpar). Notice that the starting point of each distribution changes with area, indicating that at smaller spatial scales, the most specialized species of the network have more interacting partners than at larger spatial scales. Yet the shape of the degree distribution is preserved. e,f, The top-ranked model describing the degree distribution of each ecological network across the area range for regional (e) and biogeographical (f) domains. Although the degree distribution of most ecological networks was characterized by the same function along the range of areas, the specific shape of each function changed with area (Supplementary Fig. 4). Area values were rescaled between 0 and 1.

