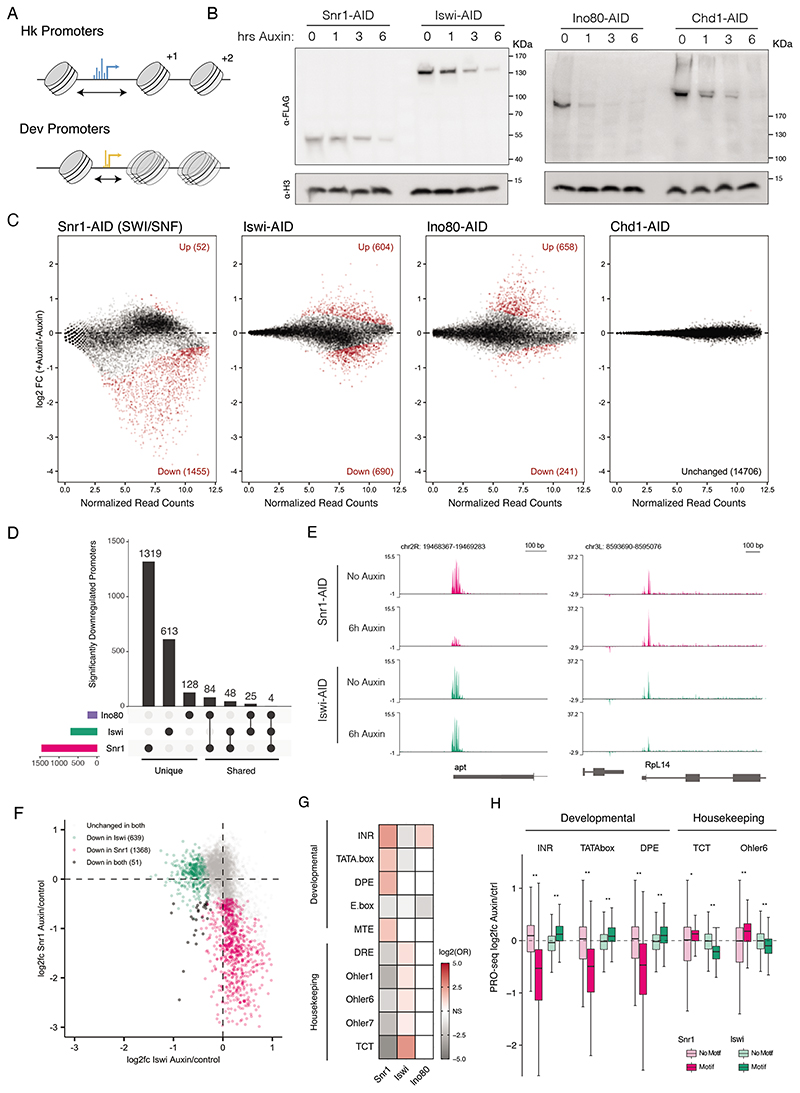
Figure 1. Chromatin remodeler depletion affects distinct gene sets.
A) Diagram of distinct nucleosome positioning at housekeeping (top) and developmental (bottom) promoter types. Housekeeping type promoters display wide NFRs (black arrow), dispersed initiation (blue) and precise downstream nucleosome positioning, while developmental type promoters have shorter NFRs, focused initiation (yellow) and fuzzy nucleosome positioning. B) Anti-FLAG (top) and anti-H3 (bottom) western blots against AID-tagged remodelers from engineered S2 cells after 0, 1, 3, and 6 hours of auxin treatment (molecular weights in KDa indicated by ticks).C) MA plots of differential transcription (PRO-seq at promoter regions of - 50bp to +150bp around the TSS) after 6 hours of auxin treatment vs. control (red points are padj < 0.05). D) Upset plot of significantly downregulated promoters after Ino80, Iswi, or Snr1 depletion. Horizontal bars indicate the total affected genes per perturbation (colors signify perturbed remodeler), vertical bars indicate number of promoters specific to a single perturbation or the indicated intersections. E)Genome browser screen shots of the apontic and Rpl14 loci showing normalized PRO-seq read coverage (library normalized counts per million) per condition. F) Comparison of gene expression changes after Snr1 depletion vs. Iswi depletion. PRO-seq promoter log2 fold-changes after Iswi/Snr1 depletion, non-affected promoters in gray, uniquely affected promoters in pink and green, and promoters affected in both conditions in black. G) Enrichment of housekeeping and developmental motifs in affected gene sets (OR: odds ratio; colors see legends; white for non-significant trends, i.e. Fisher test p-values > 0.05).H)Log2 fold-change of promoter groups split by motif presence after Snr1 or Iswi depletion (* p < 1x10⁻⁵, ** p < 2.2x10⁻¹⁶,Wilcoxon-test).

