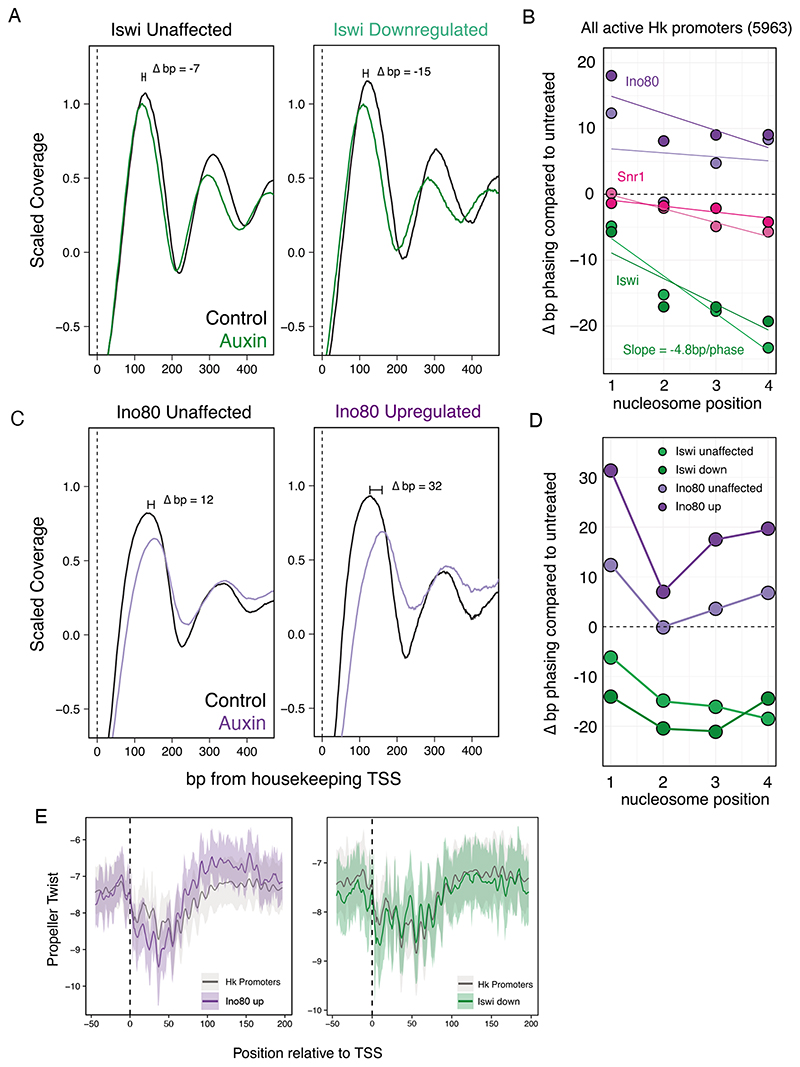
Figure 5. Iswi and Ino80 position nucleosomes at housekeeping promoters.
A) MNase-seq scaled coverage in Iswi-AID cells in control (black) and auxin treated (green) conditions. Nucleosome positioning at expressed housekeeping promoters which were unaffected (left) or downregulated (right) after Iswi depletion. B) Quantification of nucleosome positioning shifts at housekeeping promoters before and after remodeler depletion. Two replicates and linear best fit per replicate are displayed per remodeler. For Iswi, the linear model coefficient, representing the change in phase per nucleosome is displayed. C) As A but for Ino80-AID cells and at Ino80 unaffected (left) versus upregulated (right) housekeeping promoters. D) Quantification of the change in nucleosome positioning (bp) after Iswi or Ino80 depletion in unaffected and affected gene sets for Iswi and Ino80. E) Average DNA shape profiles at TSSs and +1 nucleosome regions. Left: at all housekeeping promoters and Ino80 upregulated promoters. Right: at all housekeeping promoters and Iswi downregulated promoters. Solid line indicates mean propeller twist per nucleotide and shaded areas represent the 10th to 90th percentile interval.

