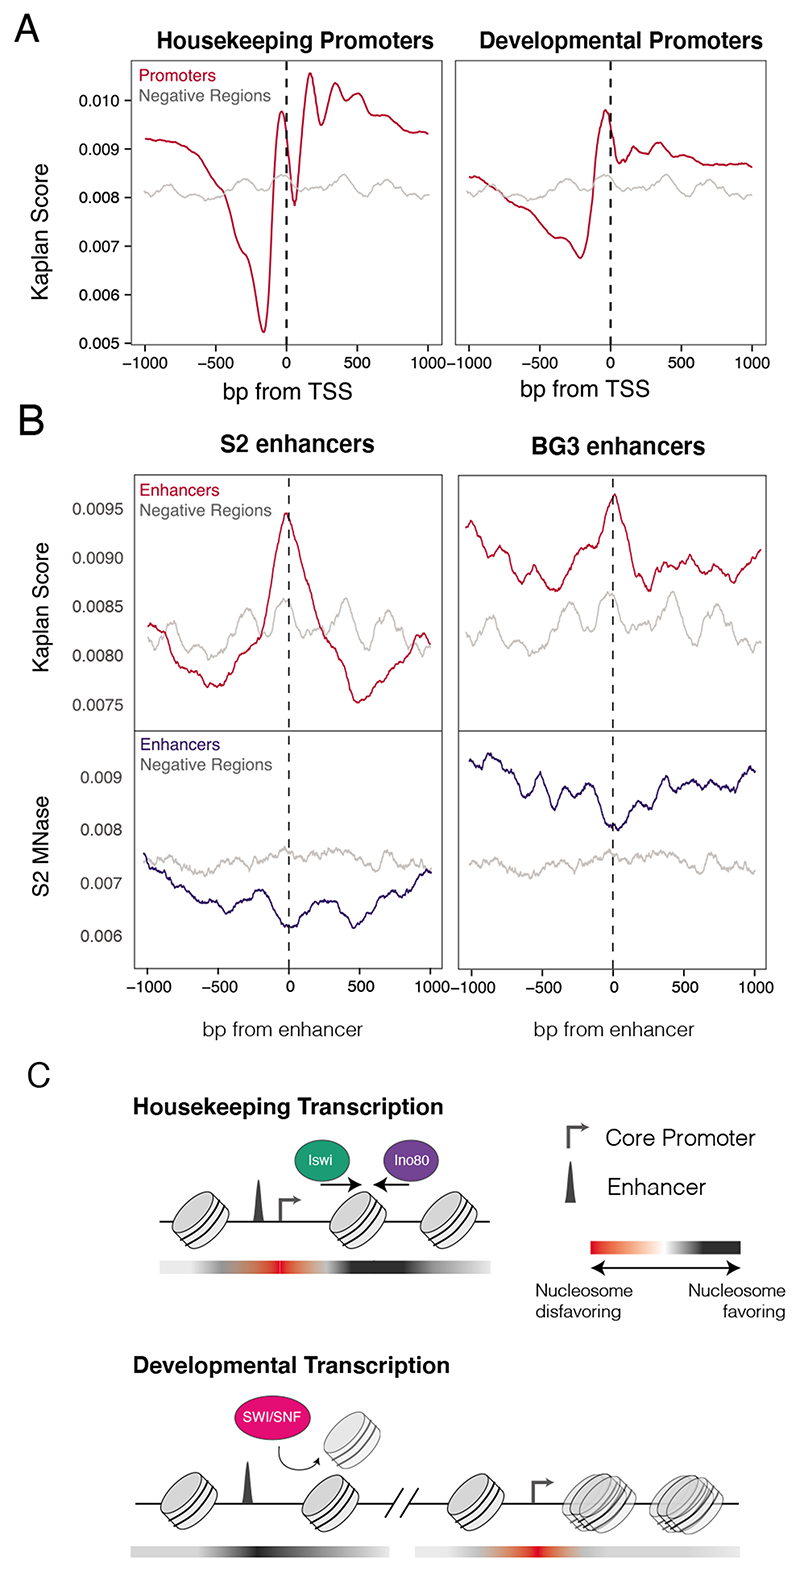
Figure 6. Nucleosome affinity profiles reflect remodeler dependencies.
A) Predicted nucleosome occupancy scores for housekeeping and developmental promoters (red), compared to negative regions (grey). B) Nucleosome affinity and accessibility for active vs. inactive cell-type-specific enhancers. Top: Nucleosome affinity scores for S2-cell specific (left) and BG3 specific (right) developmental enhancers (red) and negative regions (grey). Bottom: MNase-seq coverage profiles in S2 cells at the same regions (blue), compared to negative regions (grey). C) Model of remodeler activity and dependencies at enhancers and promoters. Red-to-black gradient depicts nucleosome favorability of DNA sequence, where red is less favorable and black is more favorable.

