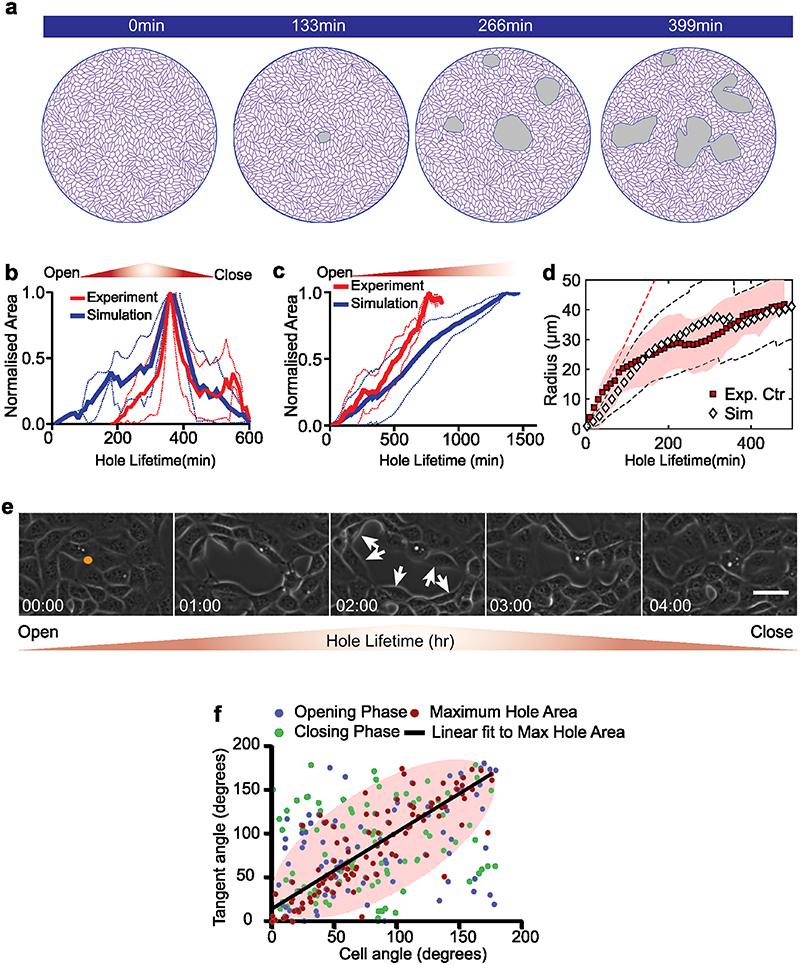
Extended Data Fig. 9. Lifetime of holes and cell organization around hole periphery.
(a) Time-lapse of a typical tissue-scale vertex model simulation (b,c) Time dependent change in hole area normalized over maximum area of the hole for simulation of (b) short-lived holes (<5hr) (n = 9 different simulations) and (c) long-lived holes (n = 9 different simulations) (d) Evolution in the estimated hole radii in experiments, mean (red squares) ± standard deviation (red shaded area) and simulations, mean (black diamonds) ± standard deviation (black dashed lines); n=14 in experiments and n=10 in simulations. (e) Time-lapse of a typical opening and closing process on soft (2.3kPa) gels. (f) Cell alignment along the tangent of the hole obtained from experiments is highly co-related during the maximum hole area. Scatter plot between cell angle and tangent angle shows the distribution during hole opening phase (blue dots), maximum hole area (red dots) and hole closing phase (green dots). A linear line (black line) fits to the maximum hole area distribution with a Pearson’s co-efficient, r = 0.83 and slope = 0.877. Majority of the maximum hole area data falls inside the pink ellipsoid area showing the small spread of their distribution.

