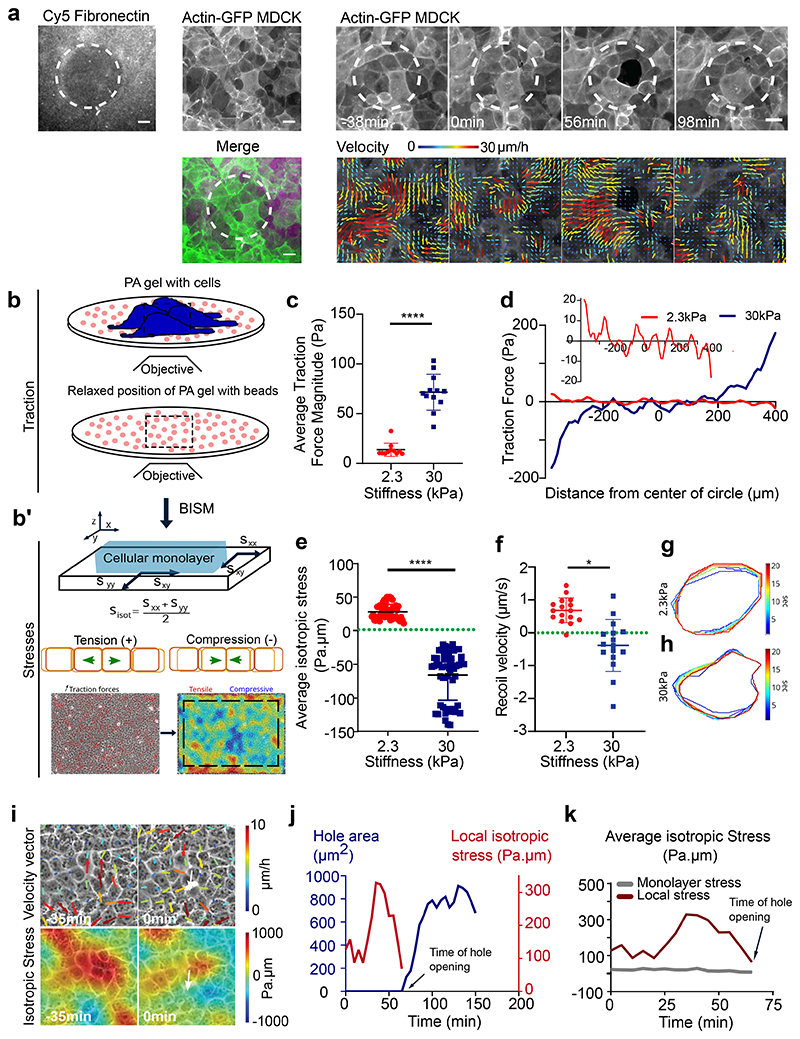
Fig. 3. Gel stiffness modulates tissue stress within MDCK monolayers.
(a) Actin GFP monolayer on a soft (2.3kPa) gel with differential coating of fibronectin with 100 μm circular islands of 50μg/ml and surroundings with 200μg/ml allows holes formation in regions of low fibronectin coating. Velocity maps show movement of cells towards the high fibronectin coated spaces. (scale: 20μm) (b) Schematic showing the method of measurement of traction forces and inferred stress (c) Average traction force magnitude increases in MDCK monolayer on soft (2.3kPa) and stiff (30kPa) gels (n = 114 time averaged for n2.3kPa = 11 different circles, 3 independent experiments & n = 183 time averaged for n30kPa = 12 different circles, 2 independent experiments; ****p <0.0001) (d) Representative graph of a confined monolayer shows that traction forces are oppositely directed on soft (2.3kPa) and stiff (30kPa) gels along the diameter of the circle (e) Average isotropic stress for no-hole regions of confined monolayers on 2.3kPa and 30kPa gels. Green dashed line represents 0 Pa.μm on the y-axis (n = 50 time averaged for n2.3kPa = 10 different circles, 3 independent experiments & n = 52 time averaged for n30kPa = 8 different circles, 2 independent experiments; ****p < 0.0001, ****p < 0.0001) (f) Recoil velocity after laser ablation of the MDCK monolayers grown on gels of different stiffnesses. Green dashed line indicates 0 μm/sec (n2.3kPa = 18 & n55kPa = 18 different movies from 2 independent experiments; *p < 0.05) (g, h) Time evolution of ROI contours for soft (2.3kPa) (g) and stiff (30kPa) (h) gels upon laser ablation. Heat map shows the evolution of time in seconds from one representative experiment. Error bars represent standard deviation. (i) Velocity vectors (top) and isotropic stress (bottom) before and during hole formation in a local region obtained from experiments on 2.3kPa PA gels. Color bar represents the respective scale bar for the values of the particular measurement and white arrow indicates the location of hole formation. (j) Change in isotropic stress (red) in a local region near a hole and the change in area of a hole (blue) as a function of time (additional trajectories are provided in Extended Figure 3). (k) Isotropic stress of the entire monolayer (grey) and isotropic stress in a local region (red) containing the hole as a function of time until the hole is formed on soft (2.3kPa gels). Solid lines indicate mean values and error bars the standard deviation.

