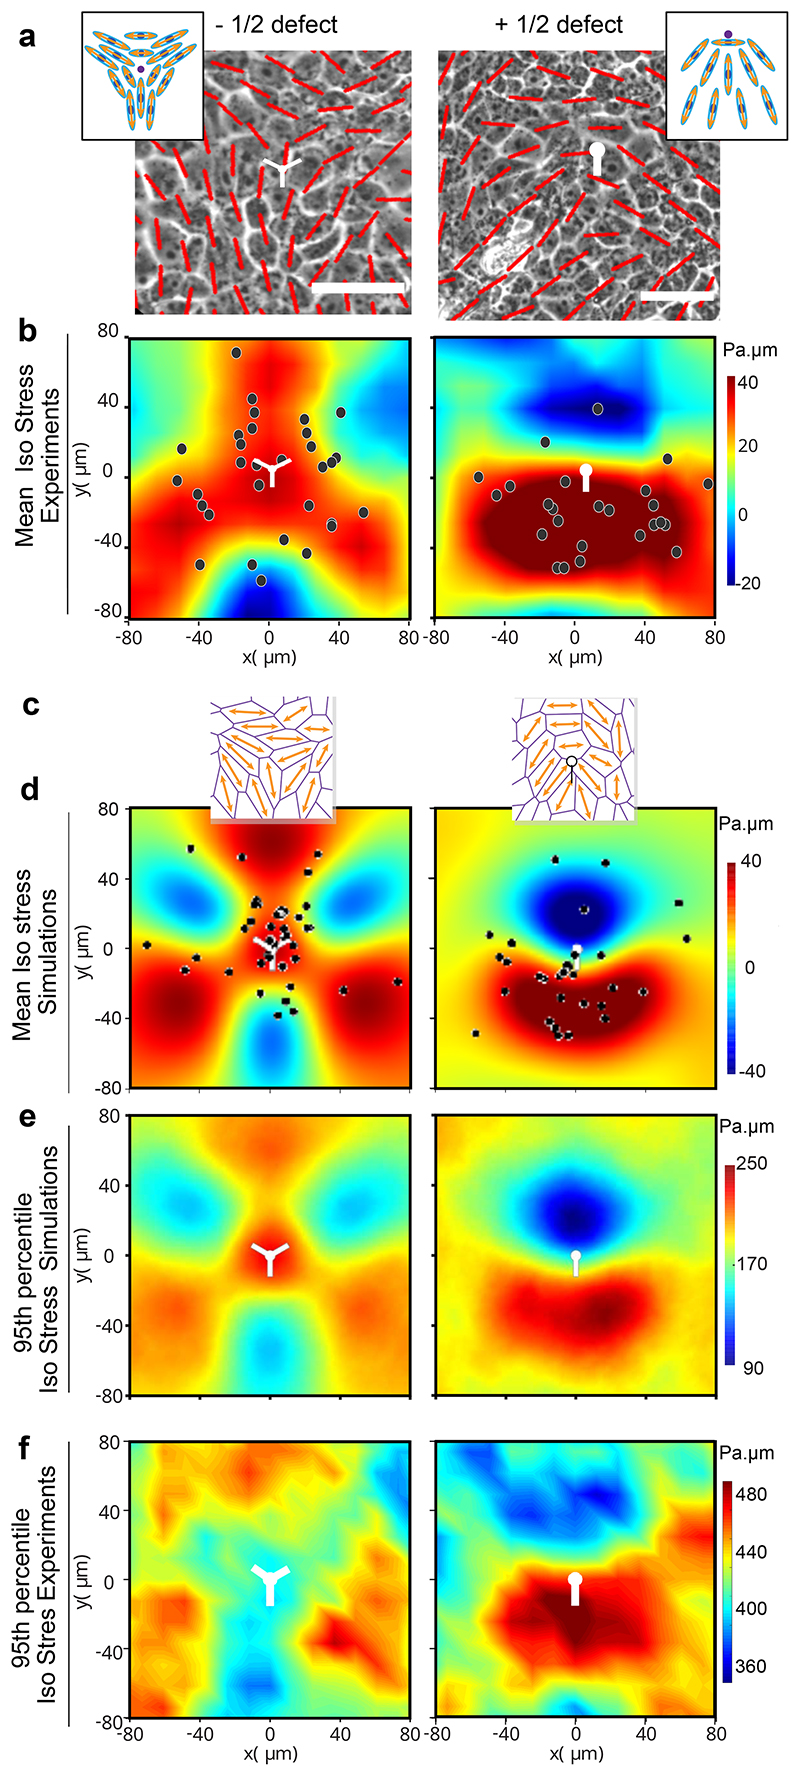
Fig. 4. Hole formation is triggered by tensile stresses around topological defects.
(a) Orientation field overlaid over phase contrast images obtained from experiments on soft (2.3kPa) gels representing -1/2 defect (left column) and +1/2 defect (right column). Scale bar: 50μm (b) Averaged isotropic stress overlaid with the location of holes in the frame of reference of the closest (left) -1/2 defect (n=2810 defects and n=35 holes) or (right) +1/2 defect (n=2924 defects and n=20 holes) obtained from experiments (c-f) Vertex model simulations (d) Averaged isotropic stress overlaid with the location of holes in the frame of reference of the closest (left) -1/2 defect (n=8555 defect and n=55 holes) or a (right) +1/2 defect (n=8553 defects and n=30 holes) (e, f) 95th percentile of isotropic stress around -1/2 defects (left) and +1/2 defects (right) obtained from vertex simulations (e) and experiments (f) The 95% percentile is the value such that 95% of the measured are below and 5% are above. White dots represent the defect core and scale bars represent limits of stress values in Pa.μm

