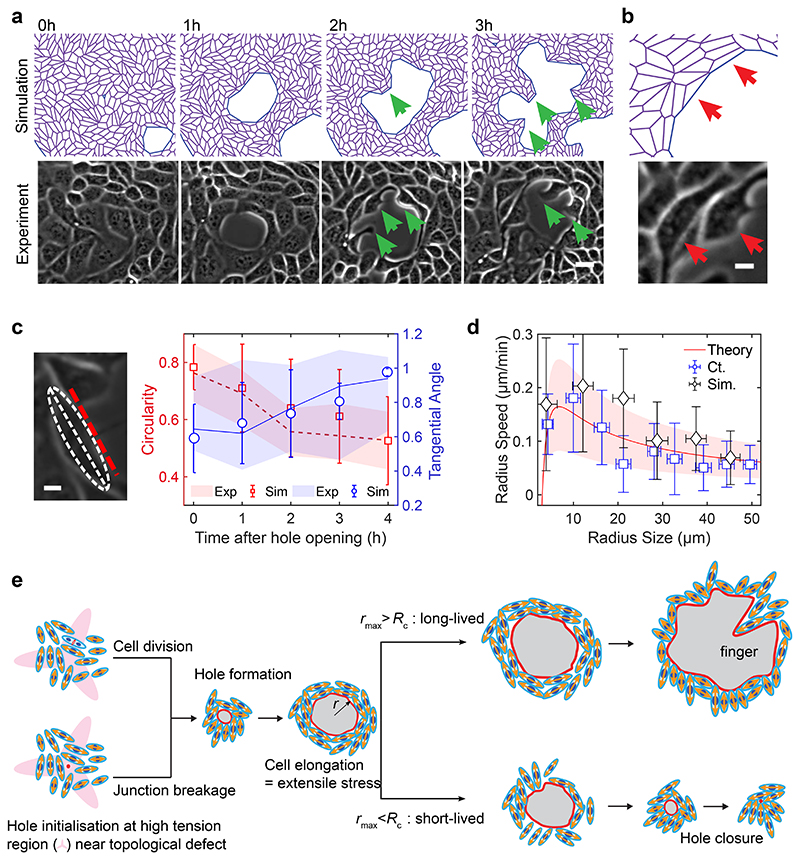
Fig. 5. Characterization of hole dynamics and cells around the hole.
(a) Finger-like projections (green arrows) formed along the hole periphery both in simulations (top) and experiments (bottom) (b) Elongation of cells around the hole obtained from simulations (top) and experiments (bottom) on soft (2.3kPa) gels (c) Morphometrics of cells along the hole periphery: circularity (red, defined as C = 4πA/P2, where A = area and P = perimeter; C = 1 for a circle) and tangential orientation (blue; cosine of the angle between the cell major axis and the tangent direction to the hole; 1 if parallel to the local hole tangent) obtained from experiments (n=14 circles from 2 independent experiments) and simulations (dashed/solid lines for the mean circularity/tangential direction. Shaded areas represent standard deviation, n = 10) (d) Rate of hole opening as a function of the hole size defined as in control experiments on soft 2.3kPa gels (mean: blue square; errorbar: half-variance; nexpt = 10 holes) and simulations (black diamond; errorbar: half-variance; nsim = 10 holes; soft case parameters, see SI) and the analytical expression Eq. (1) (solid red line for ξ = 50 Pa.μm-1.min; shaded red area in between ξ = 30 and ξ = 200 Pa.μm-1.min) (e) Schematic representing the process of hole opening. Orange arrows represent extensile activity of each particle, red spots the location of hole opening and red line represents hole boundary

