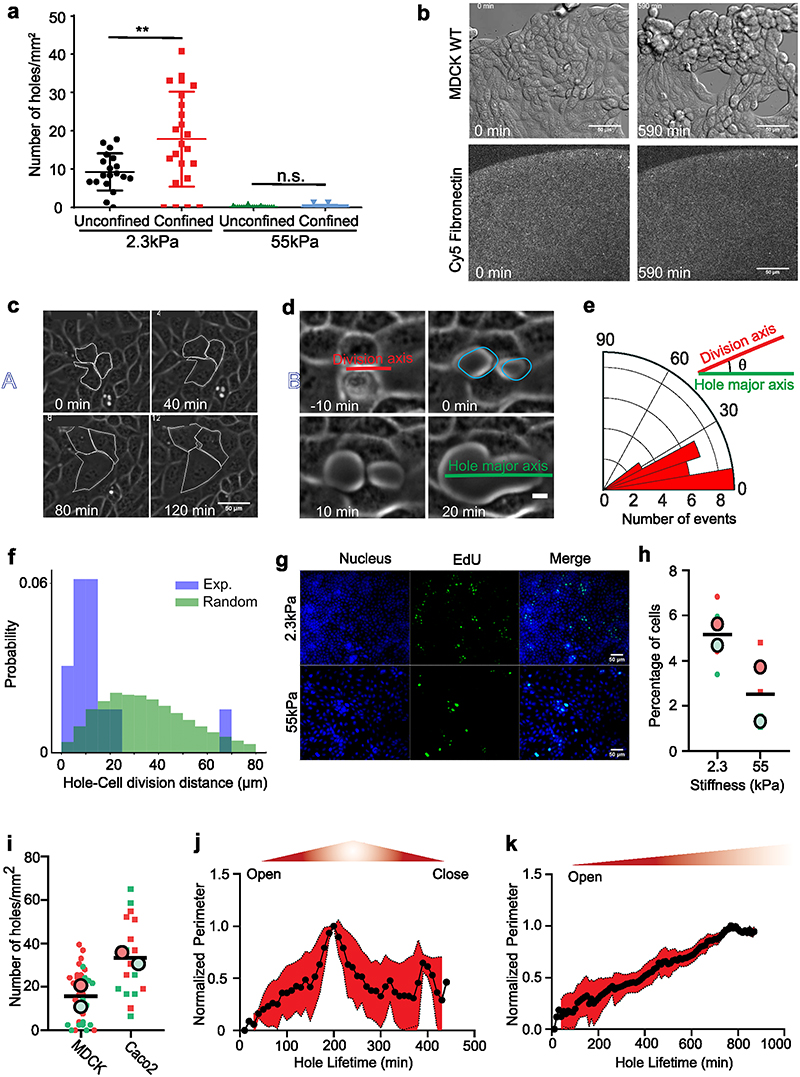
Extended Data Fig. 1. Hole formation is a dynamic process influenced by cell division.
(a) Number of holes formed on unconfined and confined monolayers on 2.3kPa and 55kPa gels. (For confined, n2.3kPa= 23 and n55kPa =15. For unconfined n2.3kPa= 19 and n55kPa=19, ****p < 0.0001) (b) Hole formation in PA gels (2.3kPa) evenly coated with fibronectin. Fibronectin coating before and after the hole formation does not change. (Scale: 50 μm) (c) Representative image of hole formation due to cell stretching on soft (2.3kPa) gels (Scale: 10 μm) (d) Illustration of hole formation after a cell division event (Scale: 5 μm). Red line represents the division axis, green line, hole major axis and yellow dots the location of hole formation (e) Angle of division axis in degree with respect to the hole major axis (n = 20 holes from 3 independent experiments) on soft (2.3kPa) gels. Green line represents major axis of the hole and red line the division axis (f) Probability distribution as a function of distance from a newly nucleated hole to the nearest cell division within 25mins of hole nucleation on soft (2.3kPa) gels, blue, experiments (n = 14 holes), green, simulation with cell divisions at random locations (identical number of divisions as in experiments) (g) Representative immunostaining images of EdU positive cells on 2.3 kPa and 55 kPa gels (h) Percentage of cells stained positive for EdU (marker of proliferation) on 2.3 kPa and 55kPa gels (n2.3kPa= 4 and n55kPa = 4 on 2 independent experiments, *p < 0.05) (i) Number of holes formed in a circular monolayer of MDCK (n = 33 different circles) and Caco2 (n = 17 different circles, *p < 0.05) on soft (2.3kPa) gels from 2 independent experiments (j, k) Change in perimeter as a function of time for (j) short-lived (n = 35 holes from 3 independent experiments) and (k) long-lived holes (n = 9 holes from 3 independent experiments) on soft (2.3kPa) gels. Solid lines represent mean and error bars the standard deviation.

