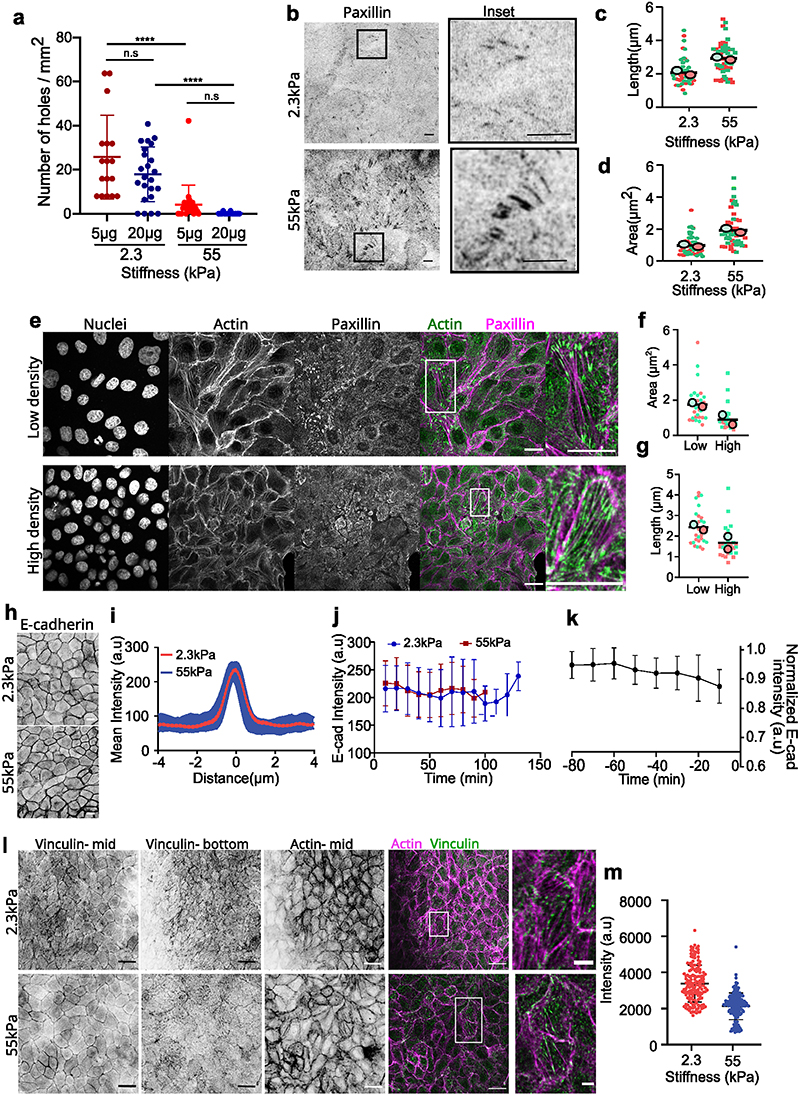
Extended Data Fig. 2. Rigidity alters focal adhesions but not cell-cell adhesions.
(a) Number of holes formed/mm2 on different concentration of fibronectin coated samples (n2.3kPa-5μg=17, n2.3kPa-20μg=23, n55kPa-5μg=23, n55kPa-20μg=15; ***p < 0.001). (b) Paxillin staining for focal adhesions formed within a MDCK monolayer on 2.3kPa (top) and 55kPa (bottom). Inset shows the zoomed image of the representative focal adhesions. (Scale: 5 μm) (c) Length (n = 69 from 2 independent experiments circles; ***p <0.001) and (d) area (n = 50 from 2 independent experiments; ***p < 0.001) of focal adhesion on 2.3kPa and 55kPa gels. (e, f, g) Immunostaining of actin (green) and paxillin (magenta) on monolayers grown on glass at low (top) and high (bottom) density and the (f, g) quantification of area (f) and length (g) of paxillin at these two different densities for n=30 focal adhesions. Scale: 20μm (h) E-cadherin localization at junctions on 2.3kPa and 55kPa gels. (Scale: 10μm) (i) Mean intensity plot of E-cadherin localization at junctions (n = 30 from 2 independent experiments) (j) Averaged E-cadherin intensity of new junctions formed after a cell division event on soft (2.3kPa) and stiff (55kPa) gels for n=33 division events from 2 independent samples for each condition. (k) Averaged E-cadherin intensity over time just before hole formation on soft (2.3kPa) gels (n=12 junctions from 2 independent experiments). (l) Immunostaining of vinculin (red) and actin (green) of monolayers grown on soft (2.3kPa) and stiff (50kPa) gels. (m) Quantification of vinculin intensity at cell junctions obtained from n2.3kPa=151 and n55kPa=166 junctions from 2 independent experiments. Solid lines represent mean and error bars standard deviation.

