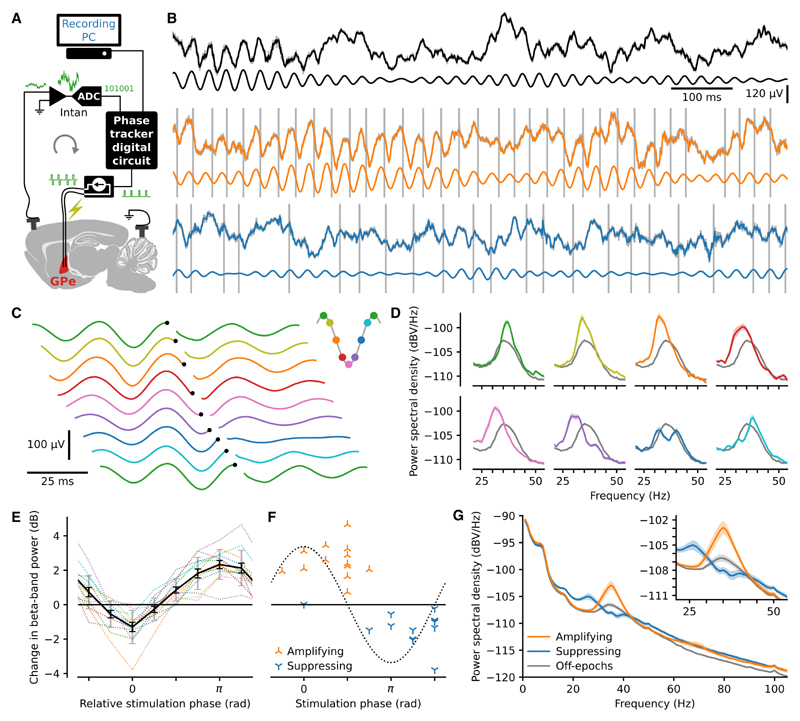
Figure 1. Phase-dependent modulation of beta-frequency oscillations.
(A) A digital circuit triggered delivery of electrical pulses to the globus pallidus at a predetermined beta-band ECoG phase.
(B) Example 1 s of raw wideband EcoG traces (pre-artefact removal) in awake, freely behaving rats (gray). Traces with artefact removal and downsampling (calculated post hoc) are superimposed (black, orange, and blue). The superimposed traces largely cover the original raw trace except at the time of the artefacts (grey). The artefacts are truncated in amplitude due to the limited plot area. The artefact-removed trace, band-pass filtered in the beta-band, isshown below each trace. Three conditions are shown: no stimulation (top, black), stimulation targeted to mid-descending phase producing amplification (middle, orange), and targeted to the mid-ascending phase producing suppression (bottom, blue).
(C) Stimulation triggered averages from the same example block of EcoG recordings, targeted to eight equally spaced phases. To aid visualization, triggertimes (black dots) are staggered across traces, and the first trace is repeated.
(D) Power spectra (mean ± SEM) from stimulation on-epochs for each target phase (colors as in C) from the same example recordings and for all off-epochs imbedded in those same recordings (gray).
(E) Change in beta-band power (on-compared with off-epochs) due to stimulation across 13 rats for 8 target phases aligned by the most suppressing target phase for each rat. Dotted lines show the values for each rat with mean ± SEM in black and SD in gray.
(F) Absolute phase versus change in beta-band power of the most suppressing and most amplifying target phases for each rat. The dotted line represents the beta cycle.
(G) Power spectral density plots (mean ± SEM, n = 13 rats).

