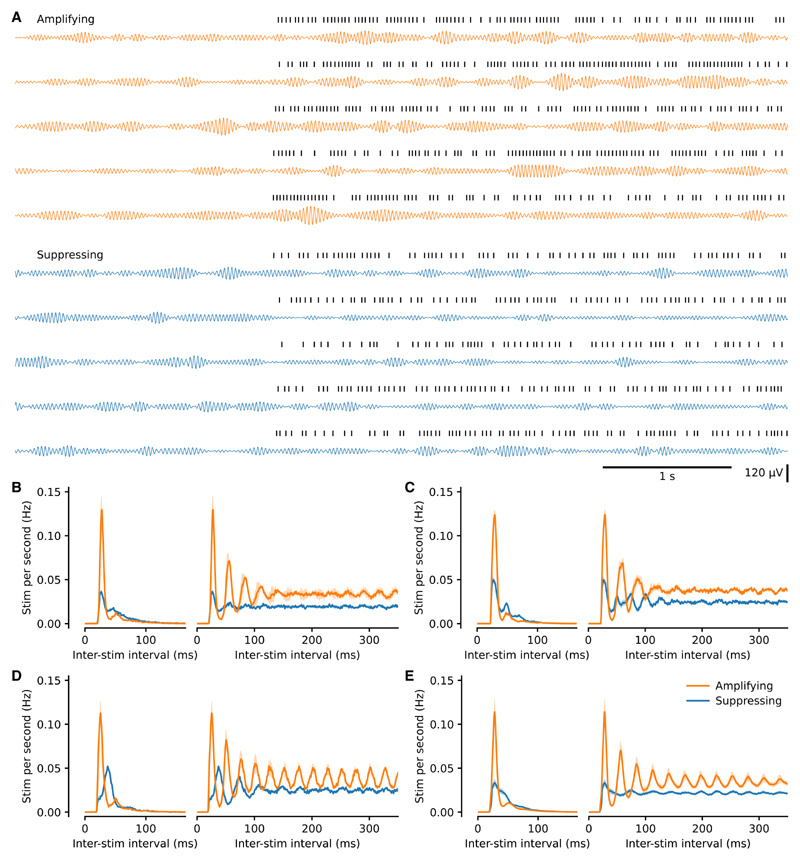
Figure 2. The pattern of stimulation differed between amplifying and suppressing stimulations.
(A) Example beta-filtered ECoG traces from maximally amplifying and suppressing conditions from the same block. Five consecutive off-to on-epoch transitions in each case. Stimulation times are shown above each trace. Note the difference in stimulation pattern between the two conditions. Beta power is similar during both sets of off-epochs, higher during stimulation targeted to an amplifying phase, and lower during suppressing stimulation yet still waxes and wanes in all conditions.
(B) Distribution (mean ± SEM from multiple recording days) of inter-stimulation intervals to the next stimulation (left) and to all subsequent stimulations (right; autocorrelogram) from the same rat as (A).
(C and D) Same as (B) for two additional example rats (C and D).
(E) Same as (B) for all animals (mean ± SEM, n = 13 rats). Note that the only experimenter-controlled variable change between amplifying and suppressing conditions was selection of a different target phase.

