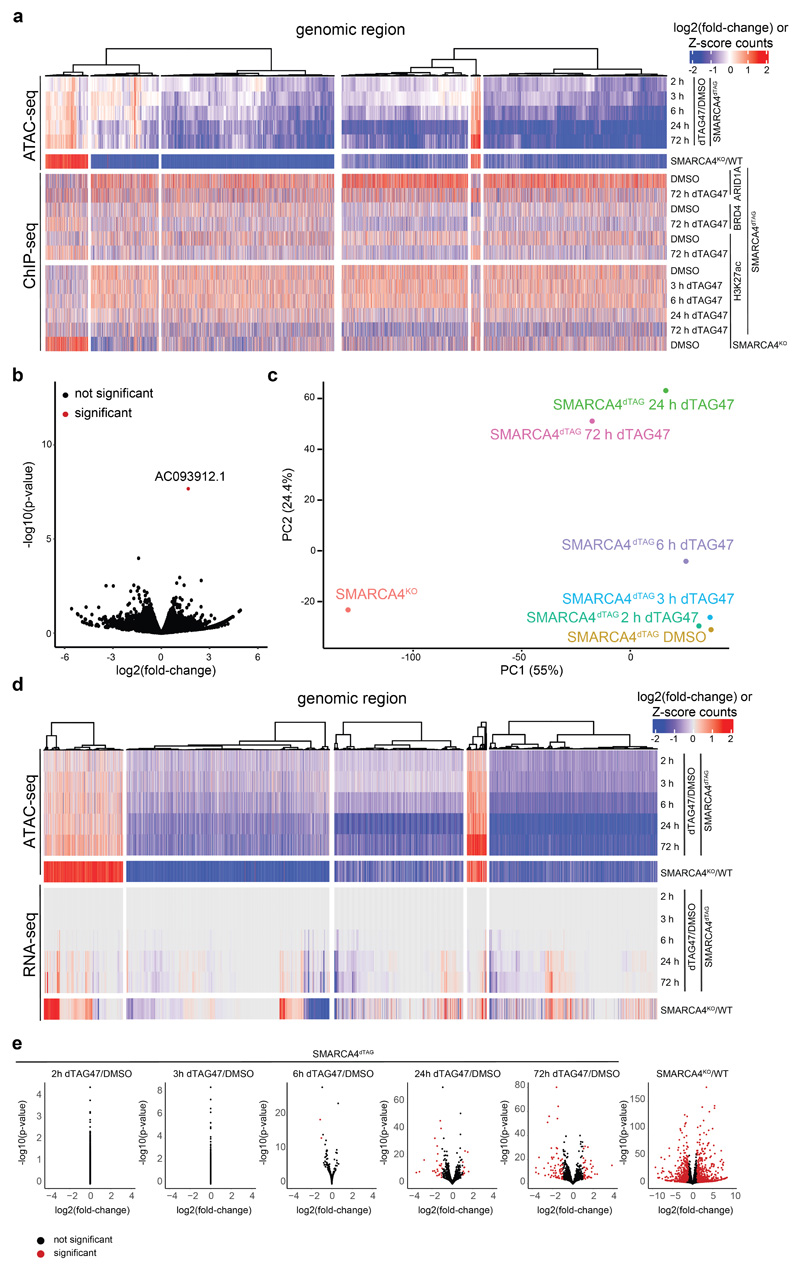
Extended Data Fig. 3. Transcriptional changes upon dTAG47 treatment.
(a) Heatmap of ATAC and ChIP-seq signal measured as log2 fold-change for genomic regions in the five WT SMARCA4dTAG time-course clusters. (b) Volcano plot of nascent transcriptional changes after 3h dTAG47 treatment in WT SMARCA4dTAG cells (PRO-seq). Significant changes (Padj < 0.01 and abs(log2 fold-change) >1) are colored in red. Two-sided Wald test was performed, False discovery rate (FDR) correction as implemented in DESeq2. (c) PCA plot of variance stabilizing transformation normalized counts from the RNA-seq experiment in WT SMARCA4dTAG cells. (d) Heatmap of ATAC and RNA-seq signal measured as log2 fold-change for genomic regions in the five WT SMARCA4dTAG time-course clusters. (e) Volcano plots of gene expression changes after dTAG treatment in SMARCA4dTAG cells compared to DMSO treatment and in SMARCA4KO cells compared to WT cells as measured by RNA-seq. Significant changes (Padj < 0.01 and abs(log2 fold-change) >1) are colored in red. Two-sided Wald test was performed, False discovery rate (FDR) correction as implemented in DESeq2.

