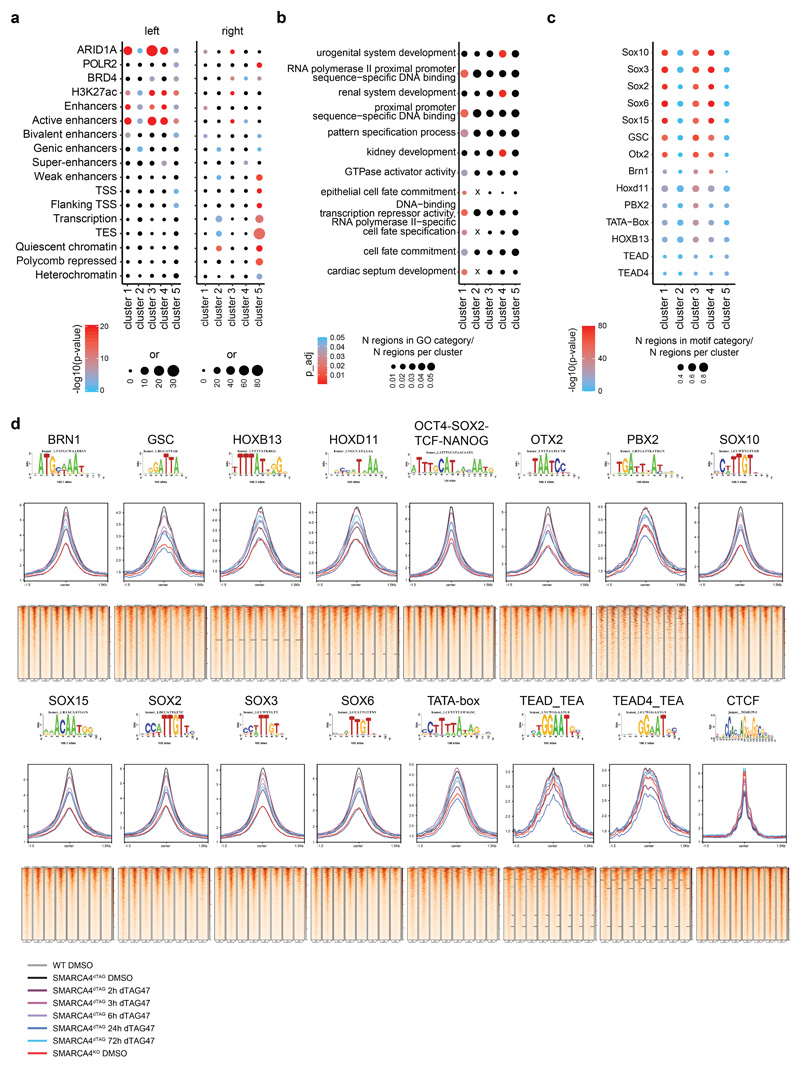
Extended Data Fig. 4. Transcription factor motif analysis in SMARCA4dTAG.
(a)(left) Enrichment of different chromatin features and factor binding in the 5 clusters compared to all consensus regions. (right) Enrichment of HAP1-specific features on genomic regions per cluster. Enrichment was calculated against regions present in the 5 clusters. Color code corresponds to -log10 p-value. Dot size corresponds to the effect size measured as odds ratio. (b) GO term enrichment for the different clusters. Only features reaching a significance threshold of p < 0.05 at a q-value of < 0.2 are depicted. (c) Motif enrichment results measured as -log10 p-value per cluster. Top 3 motifs per cluster are shown. (d) ATAC read density (RPGC normalized) at the different motifs detected in (c) shown in aggregation plots (middle) and in heatmaps (bottom) across the time-course of SMARCA4 degradation and in WT and SMARCA4KO cells. The top 2000 motif sites in the ATAC consensus peaks were analyzed.

