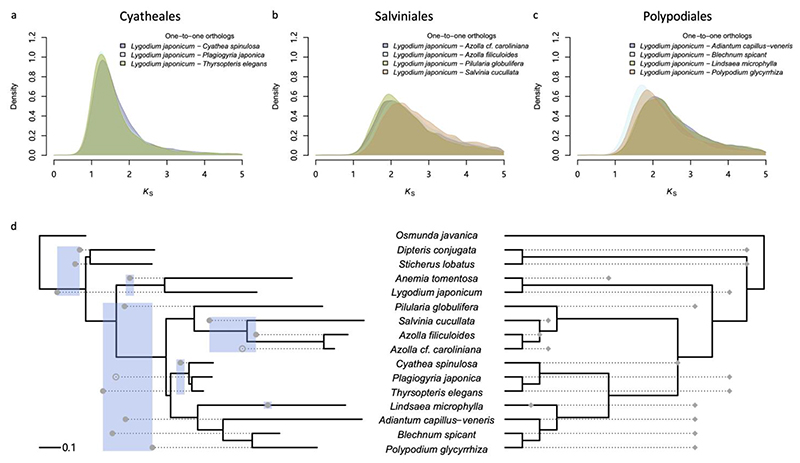
Fig. 2. Orthologous Ks distributions and WGD events identified based on Ks distributions for the whole paranomes of different fern species.
(a-c) One-to-one orthologous Ks distributions between Lygodium japonicum and species from Cyatheales (a), Salviniales (b), and Polypodiales (c). (d) WGD events identified based on Ks distributions for the whole paranome of species in the phylogeny. On the left, a species phylogram is shown with branch lengths in Ks units, while WGD events are depicted as dots (calculated as half the Ks peak value of each species starting from the corresponding tip). Solid dots denote significant Ks peaks in the SiZer analysis, whereas hollow dots denote Ks peaks only identified by GMM but not SiZer (see Materials and Methods and Fig. S3, S4). On the right, a species cladogram is shown, where WGD events are depicted as rhombs according to the analyses of ksrates (Sensalari et al. 2021). Note that when a WGD and a speciation event overlap in the ksrates analysis, the WGD event is placed at the speciation event in the cladogram.

