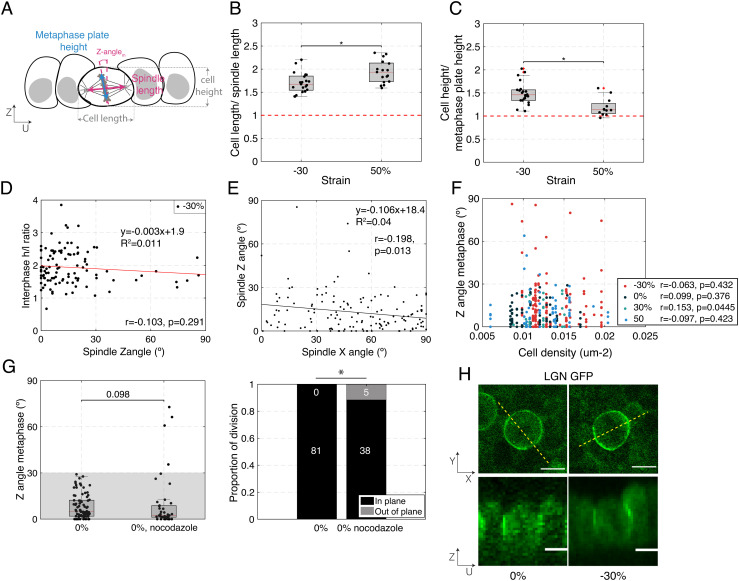
Fig. 2.
Cell shape, cell density, or localization of the spindle positioning machinery do not correlate with increased out-of-plane division induced by mechanical manipulation. (B–D, F) Box plots indicate the 25th and 75th percentiles, the red line indicates the median, and the whiskers extend to the most extreme data points that are not outliers. Individual data points are indicated by black dots. (A) Diagram indicating cell and spindle measurements in the UZ plane. Cell width is measured along the U-axis and cell height along the Z-axis. The bounds of the cell were determined from the CellMask fluorescence signal. The metaphase plate height was determined as the extent of the H2B GFP signal, and the spindle length was determined as the pole to pole distance visualized using SiR-tubulin fluorescence signal. (B) Ratio of cell width to spindle length for dividing cells in compressed (−30%) and stretched monolayers (50%). N = 21 cells for −30% strain and N = 17 cells for 50% strain. Data from n = 2 and n = 1 independent days, respectively. (C) Ratio of cell height to metaphase plate height for dividing cells in compressed (−30%) and stretched monolayers (50%). N = 22 cells for −30% strain and N = 12 cells for 50% strain. Data from n = 2 and n = 1 independent days, respectively. (D) Ratio of cell height h to length l at interphase as a function of spindle Z-angle for dividing cells in compressed monolayers (−30%). N = 102 cells from n = 14 independent days. Correlation coefficient, r = −0.103, P-value (two-tailed Student's t-distribution) = 0.291. (E) Spindle Z-angle as a function of spindle X-angle for cells in monolayers subjected to −30% strain. The solid line shows the linear regression. The slope of the regression and the coefficient of determination R2 are indicated on the graph. N = 142 cell divisions. Correlation coefficient, r = −0.198, P-value (two-tailed Student's t-distribution) = 0.013. (F) Spindle Z-angle as a function of cell density for monolayers subjected to different amplitudes of uniaxial strain. N = 147 cells for −30% (red dots), 81 cells for 0% (black dots), 27 cells for 30% (light blue dots), and 68 cells for 50% strain (dark blue dots). Experiments were performed on n = 14, n = 8, n = 4, and n = 8 independent days. −30%: Correlation coefficient, r = −0.063, P-value (two-tailed Student's t-distribution) = 0.432. 0%: Correlation coefficient, r = 0.099, P-value (two-tailed Student's t-distribution) = 0.376. 30%: Correlation coefficient, r = 0.153, P-value (two-tailed Student's t-distribution) = 0.445. 50%: Correlation coefficient, r = −0.097, P-value (two-tailed Student's t-distribution) = 0.423. (G) Left – Distribution of spindle Z-angles at metaphase for untreated monolayers and monolayers treated with 20 nM nocodazole. WRST (P = 0.098). Gray box highlights Z-angles <30°. N = 81 mitotic cells for 0% strain, N = 39 for nocodazole treatment. Experiments were performed on n = 8 and n = 2 independent days, respectively. The data shown for 0% strain are from Fig. 1E. Right – Proportion of spindles dividing in-plane and out-of-plane as a function of strain. Out-of-plane divisions are shown in gray and in-plane divisions in black. The number of divisions in each category is indicated in the corresponding region of the bar. Comparison of nocodazole treated cells with untreated cells with a FET: P = 0.004. (H) Representative localization of LGN in dividing cells in a monolayer subjected to 0% and −30% compressive strains viewed in XY (Top) and UZ (Bottom) planes. Dashed yellow lines indicate the locations at which UZ profiles were taken. (Scale bars: 10 μm.)

