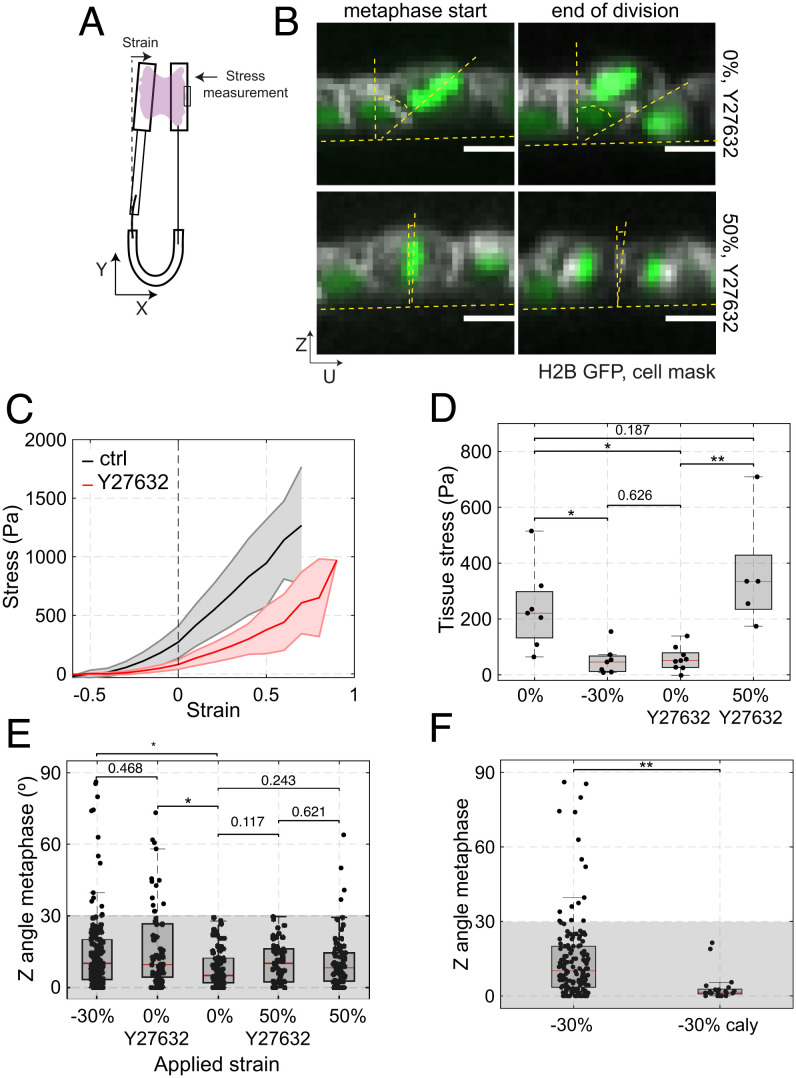
Fig. 3.
The accuracy of in-plane cell division is controlled by tissue tension. (D–F) Box plots indicate the 25th and 75th percentiles, the red line indicates the median, and the whiskers extend to the most extreme data points that are not outliers. Individual data points are indicated by black dots. (A) Diagram of the device used for measurement of stress during application of uniaxial strain. Monolayers are cultured between a reference rod and a flexible rod. Measurement of the deflection of the flexible rod allows determination of the stress applied to the epithelium (see Methods). (B) Example of cell division in a monolayer treated with 50 μM Y27632 at 0% (Top row) and 50% strain (Bottom row). Spindle Z-angle is measured at the beginning of metaphase (Left) and at the end of division (Right). Nucleic acids are visualized with H2B GFP (green), the cell membrane is labeled with CellMask 568 dye (white). In the profile views, the horizontal yellow dashed lines indicate the plane of the monolayer, while the angle between the slanted and vertical dashed lines indicate the orientation of the metaphase plate or the division furrow. (Scale bars: 10 μm.) (C) Tissue stress as a function of strain in response to a ramp in deformation applied at low strain rate (0.5%.s−1) for control (black) and Y27632-treated (red) monolayers. Solid lines indicate the mean and the shaded area shows the SD. N = 7 monolayers for control and N = 8 monolayers for Y27632 treatment. n = 4 and n = 5 independent days, respectively. (D) Tissue stress in MDCK monolayers as a function of strain in control conditions and in monolayers treated with 50 μM Y27632. WRST, P = 0.0041 (−30%, 0%), P = 0.626 (−30%; 0% + Y27632), P = 0.0009 (0% + Y27632, 50% + Y27632), P = 0.187 (0%, 50% + Y27632). (E) Distribution of spindle Z-angles at metaphase for nontreated monolayers at −30%, 0%, and 50% strain, and monolayers treated with 50 μM Y27632 at 0% and 50% strains. Gray box highlights Z-angles <30°. The number of mitotic cells examined for each condition was N = 147 for −30% strain, N = 66 for 0% strain with Y27632, N = 81 for 0% strain, N = 53 for 50% strain with Y27632, and N = 68 for 50% strain. Data from n = 14, n = 8, n = 8, n = 11, and n = 8 independent days, respectively. The data shown for −30% strain, 0% strain, and 50% is from Fig. 1E. Comparisons are as follows: P(0%, −30%) = 0.003, P(0%, 0% + Y27632) = 0.002, P(0%, 50% + Y27632) = 0.117, P(0%, 50%) = 0.243, P(−30%, 0% + Y27632) = 0.468, P(50%, 50% + Y27632) = 0.621. (F) Distribution of the spindle Z-angles at metaphase for monolayers subjected to −30% strain in control conditions or treated with 35 nM calyculin. WRST, P = 1.945 10−5. Gray box highlights Z-angles <30°. N = 147 mitotic cells for −30% strain and N = 21 for −30% strain with calyculin treatment. Data from n = 14 and n = 2 independent days, respectively. The data shown for −30% strain is from Fig. 1E.

